The rent-to-value ratio is a simple but powerful tool for anyone thinking about buying a home, especially if you see it as a potential investment. In plain terms, it compares a property's yearly rental income to its market value. The result is a percentage that gives you a quick snapshot of how hard the property can work for you financially.
This guide will walk you through what this ratio means, how to calculate it, and why it's a critical first step for both future homeowners and budding investors.
What Does the Rent to Value Ratio Actually Tell You?

Think of the rent-to-value ratio as a property’s "income efficiency" score. It answers a fundamental question: for every dollar you spend buying this home, how much can you expect to get back in rent each year?
For a home buyer, this is important for a couple of reasons:
- It helps gauge affordability: If the potential rent in an area is high compared to home prices, it can signal a market where buying might be more financially sound than renting.
- It reveals investment potential: Even if you plan to live in the home now, you might rent it out down the road. This ratio gives you an early look at its potential as an income-generating asset.
It’s one of the first numbers savvy investors look at to quickly sort through listings. A high ratio can signal a strong income producer, while a low one might suggest the property’s value is more about long-term growth than immediate cash flow.
A Quick Glance Breakdown
Before you start crunching numbers, it helps to understand what each piece of the formula represents. The metric is built on two key data points that, together, paint a clear picture of an investment's health. Getting a solid handle on what the ratio shows starts with understanding rental income and its tax implications.
Let's break down the components of the rent-to-value ratio.
Rent To Value Ratio At A Glance
| Component | What It Represents | Why It's Important for a Buyer |
|---|---|---|
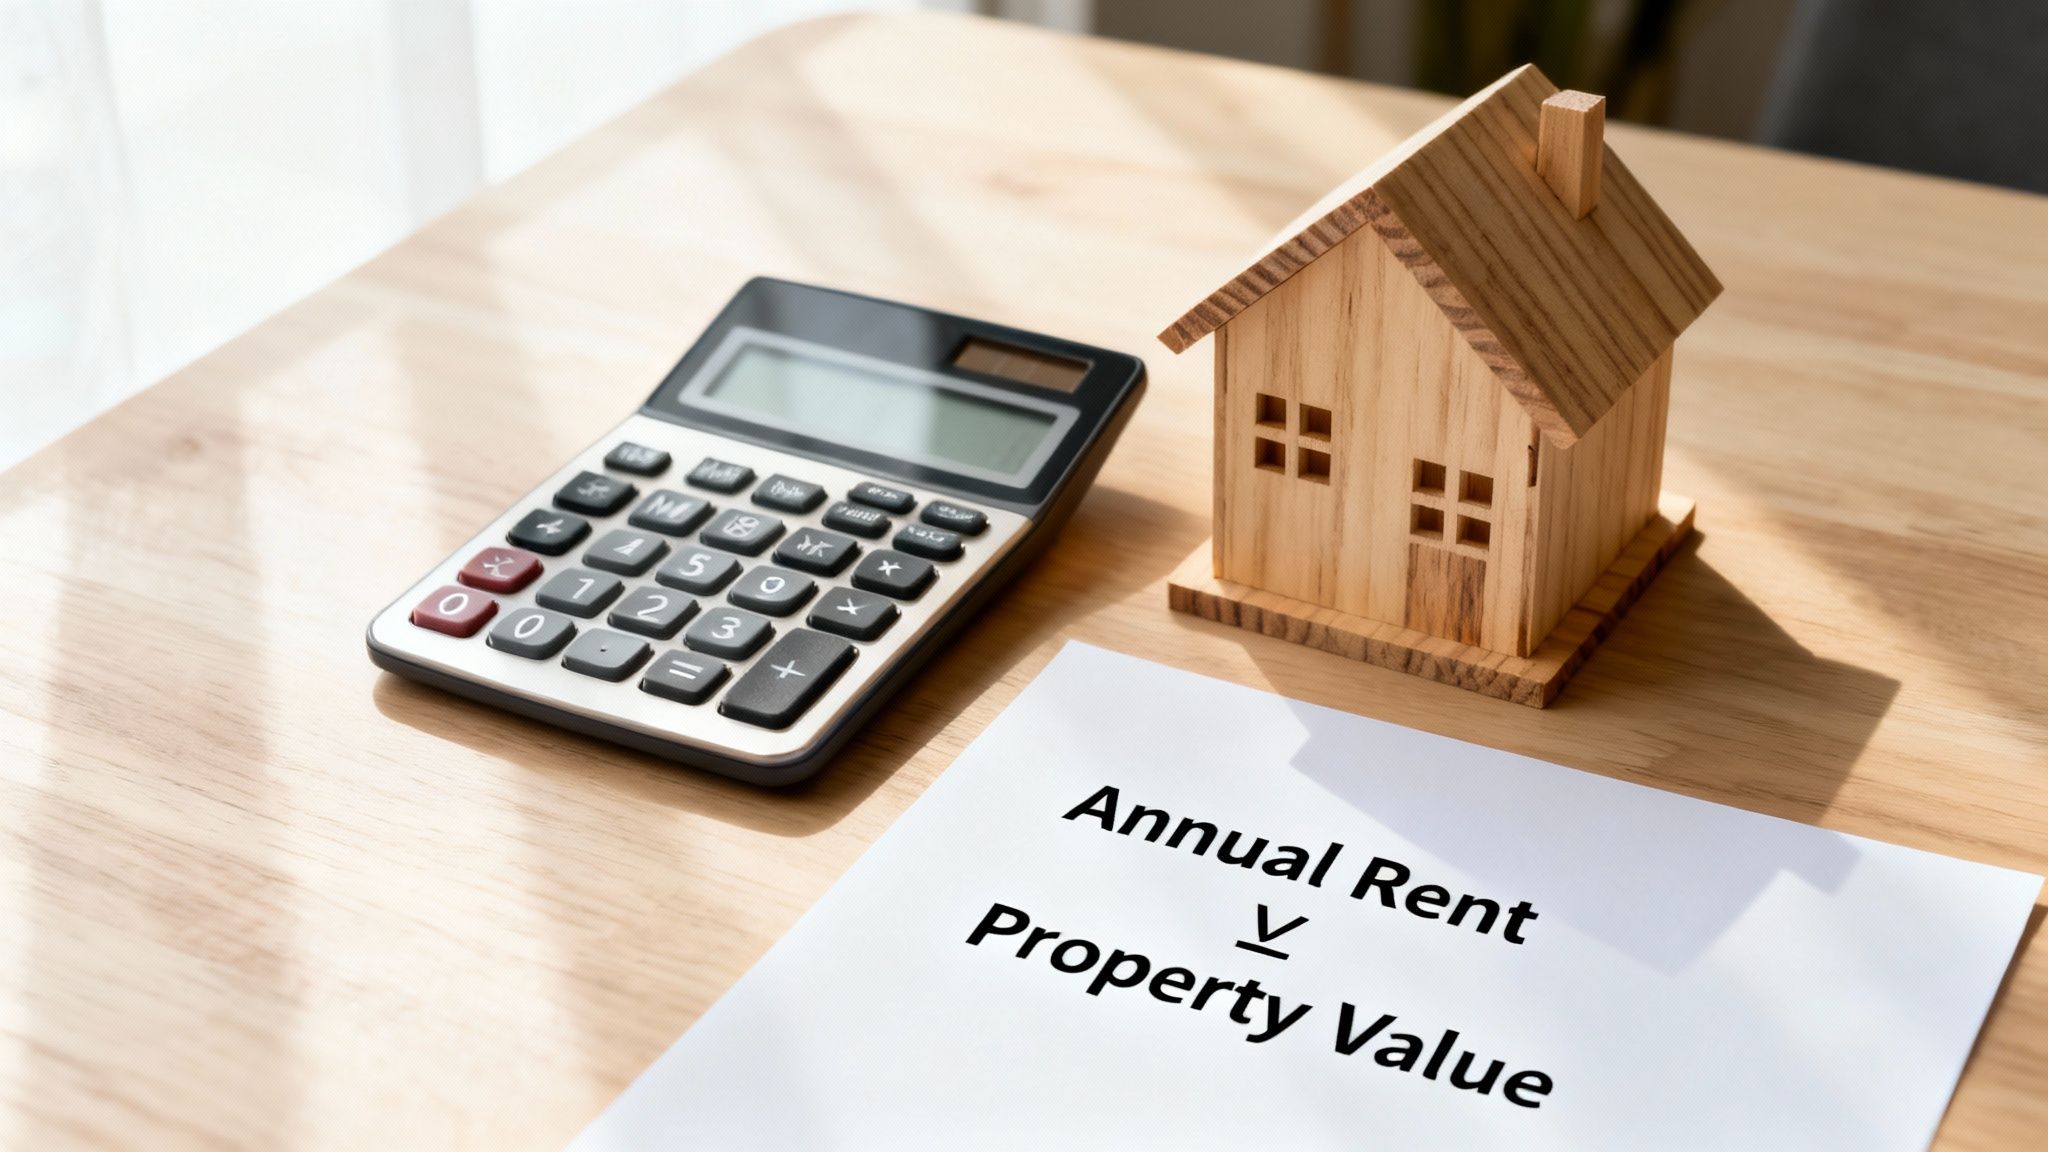
| Annual Rent | The total gross income the property could generate from rent over one year, before any expenses are deducted. | This is the property's raw income-generating power and a key indicator of local rental demand. |
| Property Value | The home's current market price—what you would pay to purchase it. | This represents your initial investment and the foundation upon which all future returns are built. |
| The Ratio (%) | The relationship between the annual rent and the property's total value. | It provides a simple benchmark to quickly compare different properties, regardless of their price. |
At its core, the ratio asks a simple question: "For the price I'm paying, is the potential rent I could collect strong enough?" It’s a powerful first filter in any property analysis.
How to Calculate the Rent to Value Ratio: A Step-by-Step Guide
Ready to run the numbers yourself? The great news is that calculating the rent-to-value ratio is easy. You don’t need a fancy spreadsheet or a finance degree to get a quick read on a property's income potential.
The formula is perfect for quick, on-the-fly analysis.
Rent to Value Ratio = (Annual Gross Rent / Property Value) x 100
This calculation gives you a simple percentage, showing you how much of the property's value you could get back each year in raw rental income. A higher percentage is usually a good sign, as it points to stronger potential cash flow relative to your purchase price.
Breaking Down The Formula
Before you start plugging in numbers, let's clarify the two key components. Getting these right is essential for an accurate result.
- Annual Gross Rent: This is the total rent you'd collect over 12 monthsbefore taking out any expenses. If a similar property in the neighborhood rents for $2,000 a month, your estimated annual gross rent is $24,000 ($2,000 x 12).
- Property Value: This is simply the asking price or the home's current market value. When you're analyzing a potential purchase, this will be the price you expect to pay.
Important Takeaway: This formula is a starting point. It's a fantastic tool for quick comparisons but doesn't account for ongoing costs like property taxes, insurance, or repairs. For a deeper look at true profitability, you’ll eventually want to learn more about how to calculate rental yield, which factors in those expenses.
Real-World Calculation Examples
Let's walk through the formula with two different properties to see how it works.
Example 1: The Suburban Starter Home
Imagine a single-family home in a quiet suburb is listed for $350,000. After checking local listings, you find that similar homes rent for $2,100 per month.
- Calculate Annual Gross Rent:$2,100/month x 12 months = $25,200
- Divide by Property Value:$25,200 / $350,000 = 0.072
- Convert to a Percentage:0.072 x 100 = 7.2%
The rent-to-value ratio for this suburban home is 7.2%.
Example 2: The Urban Duplex
Now let's look at a duplex in a busy city neighborhood with a purchase price of $500,000. Each of the two units rents for $1,600 a month, for a total monthly income of $3,200.
- Calculate Annual Gross Rent:$3,200/month x 12 months = $38,400
- Divide by Property Value:$38,400 / $500,000 = 0.0768
- Convert to a Percentage:0.0768 x 100 = 7.68%
The urban duplex has a slightly higher ratio of 7.68%. This suggests it generates more rental income for every dollar of its value compared to the suburban house. This simple exercise gives you a powerful way to compare different properties on an even playing field.
What's a Good Rent to Value Ratio for a Home Buyer?
So, you’ve run the numbers and have your percentage. Now what? That number is pretty meaningless without some context.
Think of it like this: a higher ratio often points to a property with strong immediate income potential. A lower one might signal that the real financial benefit is in long-term appreciation (the value of the home going up). There's no single "magic number" that's right for everyone; the key is knowing what aligns with your financial goals.
A good rent-to-value ratio isn't a universal constant. It's shaped by your goals, the type of property, and the unique pulse of the local housing market. What’s considered excellent in a slow-and-steady town might just be average in a booming city.
General Benchmarks For Ratios
While every market is different, you can use these general benchmarks as a starting point to see where a property stands.
- Low Ratio (Below 5%): This usually means property prices are high compared to what they can rent for. You won't find strong monthly cash flow here. These properties are often in high-demand areas where buyers are banking on the home's value to increase significantly over time.
- Good Ratio (5% to 8%): For many people, this is a healthy range. Properties here often offer a good balance of potential rental income and a solid chance for future value growth.
- Excellent Ratio (Above 8%): A ratio this high signals very strong cash flow potential. These are often found in markets with lower property values or very high rental demand, making them attractive to investors focused on immediate income.
Why Location and Your Goals Matter Most
A "good" ratio is all about context. A condo in a buzzing tech hub might only have a 4% ratio, but its value could skyrocket over the next ten years. On the other hand, a duplex in a stable Midwest town might boast an 8% ratio, delivering consistent income but much slower appreciation.
Market dynamics are a huge piece of the puzzle. Global price-to-rent ratios show massive differences from one country to another. Some markets show it's far cheaper to rent than to buy, which can signal either overvalued homes or fantastic opportunities for rental investors. It’s a great reminder of how local economics define what a good ratio actually is. You can see these international real estate trends for yourself to get a bigger picture.
Ultimately, it comes back to your personal strategy. Are you looking for a home in an area with long-term growth potential, or is having the option for strong rental income a priority? Answering that will tell you what a "good" rent-to-value ratio looks like for you.
How The Rent-to-Value Ratio Stacks Up Against Other Metrics
Think of the rent-to-value ratio as your first quick check. It tells you if a property is financially "hot or cold," but it doesn't give you the full diagnosis. To really understand a deal's potential, savvy buyers use a complete toolkit of metrics.
Layering different calculations gives you a much richer, more complete picture of an investment. While the rent-to-value ratio is great for quick comparisons, other metrics dive deeper into true profitability and long-term returns. Let's look at a few key ones.
This chart gives you a quick visual guide for interpreting the ratio, from properties with low potential to those signaling strong cash flow.
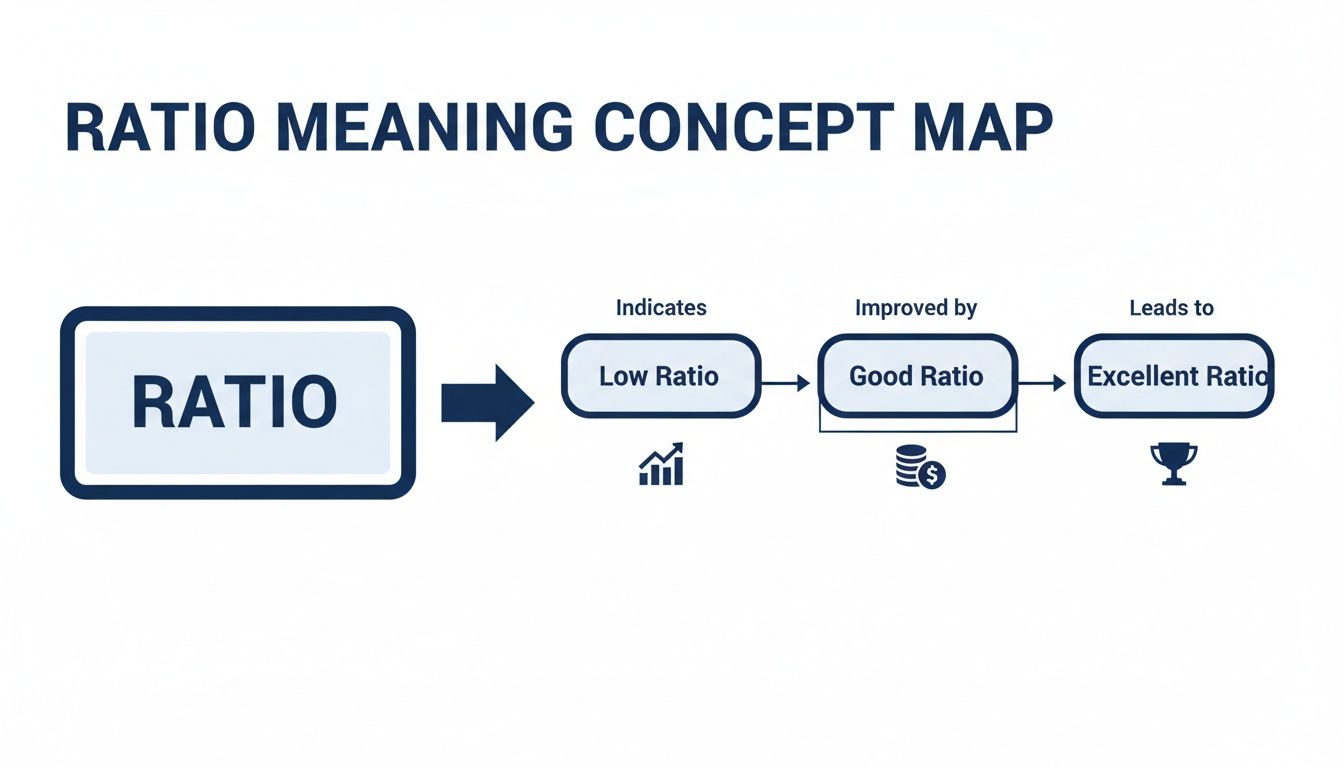
As you can see, a high ratio is a great sign of a property's immediate power to generate income. But what about profit? That's where the next metrics come in.
The 1% Rule
The 1% Rule is more of a guideline than a strict formula, but it’s popular for its simplicity. It’s the ultimate back-of-the-napkin test for quickly screening properties.
The rule suggests a property's monthly rent should be at least 1% of its purchase price. If it meets that benchmark, it's worth a closer look for its cash flow potential.
For a $300,000 home, the 1% Rule says it needs to rent for at least $3,000 per month. Any property meeting or beating this is a good candidate for further analysis.
- When to Use It: Use this while scrolling through listings to instantly flag properties that might have strong rental income relative to their price.
Gross Rent Multiplier (GRM)
The Gross Rent Multiplier (GRM) is a close cousin to the rent-to-value ratio. Instead of showing a percentage return, it tells you how many years it would take for the gross rent to completely pay for the property.
The formula is simple: GRM = Property Value / Annual Gross Rent
A lower GRM is better because it means a quicker payback period. For example, a $400,000 property bringing in $40,000 in annual rent has a GRM of 10.
- When to Use It: GRM is another great tool for fast comparisons between similar properties in the same market, helping you see which one offers a faster path to recouping your investment based on gross income.
Capitalization Rate (Cap Rate)
The Capitalization Rate, or Cap Rate, is the logical next step in your analysis. While our rent-to-value ratio looks at gross rent, the Cap Rate gets real by focusing on the property's Net Operating Income (NOI).
NOI is your annual rental income after you subtract all operating expenses—things like property taxes, insurance, management fees, and maintenance. It’s what’s left over before your mortgage payment.
The formula is: Cap Rate = (Net Operating Income / Property Value) x 100
- When to Use It: You use the Cap Rate when you’re ready to move past initial screening and analyze the real profitability of your top choices. It gives a much more accurate picture of your potential return. To dive deeper, you can read our detailed guide on what capitalization rate is and how to apply it.
Comparing Key Real Estate Metrics
Each of these metrics tells a different part of the story. Here’s a simple table to help you keep them straight and know when to use each one.
| Metric | What It Measures | Best Use Case |
|---|---|---|
| Rent-to-Value Ratio | Gross rental income as a percentage of property value. | Quick, high-level screening of many properties at once. |
| The 1% Rule | Whether monthly rent meets a minimum cash flow threshold. | Instant "go/no-go" test while browsing listings online. |
| Gross Rent Multiplier | How many years of gross rent it takes to pay for the property. | Comparing the payback speed of similar properties in the same area. |
| Cap Rate | The property's unleveraged return based on net income. | Deeper analysis of a shortlisted property's actual profitability. |
By using these metrics together, you can build a much more robust analysis. Start broad with the 1% Rule and Rent-to-Value Ratio to filter dozens of listings down to a handful. Then, use GRM and Cap Rate to perform a deep dive on the properties that truly catch your eye. This systematic approach ensures you're not just finding houses, but finding the right one for your financial future.
Why Market Trends and Timing Are Important
The rent-to-value ratio isn't a static number. Think of it as a living metric that shifts with the market, changing as economic forces push and pull on both rents and property values.
Looking at a single snapshot in time can be misleading. Things like interest rate changes, local job growth, and new housing supply are always at play. In a hot market, for instance, home prices can shoot up much faster than rents, squeezing the rent-to-value ratio. On the other hand, during a market cool-down, you might see home prices dip while rents hold steady, making that same ratio look much more attractive.
Navigating Market Cycles
The relationship between rent and value tends to follow a rhythm. History shows that when home prices climb rapidly and leave rent growth behind, it can be a red flag for an overvalued market. This pattern has played out in the U.S. and globally.
For example, recent data from 18 advanced economies showed that the house price-to-rent ratio jumped by an average of 16% in the first two years of recent cycles, only to drop by 10% after peaking. This is almost a mirror image of what happened in the U.S. after 2006, where a similar ratio fell over 20% in just four years as high home prices corrected while rents stayed relatively firm.
The Challenge of Timing the Market
Spotting these trends is one thing, but timing your purchase perfectly is another. The dream is to buy when the ratio is strong and avoid paying top dollar at the market's peak. But honestly, predicting the exact top or bottom of a market is nearly impossible.
While it’s crucial to understand these cycles, investors also have to wrestle with the complexities of market timing. Instead of trying to be a market psychic, a much smarter approach is to focus on the fundamentals:
- Look at long-term trends: Are people and jobs consistently moving into the area? That’s a good sign.
- Keep an eye on supply and demand: Is new construction keeping pace with new residents?
- Stress-test your numbers: Make sure the purchase still makes sense even if rents dip slightly or it takes time to find a tenant in the future.
By grounding your decisions in solid fundamentals, you can invest with confidence regardless of short-term market swings. The rent-to-value ratio becomes your trusted guide, not a crystal ball.
Common Blind Spots Of The Rent To Value Ratio
To use any tool effectively, you have to know its limitations. The rent-to-value ratio is an excellent first filter, but relying on it alone is like buying a car after only checking its gas mileage. It tells you nothing about the engine's health, maintenance costs, or how much your insurance will be.
The ratio's biggest blind spot is that it completely ignores expenses. It’s calculated using gross rent, which means it doesn't account for the real-world costs that will affect your bottom line every month.
The rent-to-value ratio provides a useful but incomplete snapshot. It highlights potential income but hides the operating expenses that ultimately determine a property's true profitability.
By understanding what the ratio leaves out, you can use it wisely for a quick "go or no-go" decision before spending time on a deeper analysis.
What The Ratio Fails To Tell You
The number one rule of real estate investing is that your gross rent is not your net profit. Several crucial factors are invisible to the rent-to-value ratio, and overlooking them can turn a promising purchase into a financial headache.
Here are the key things this metric completely overlooks:
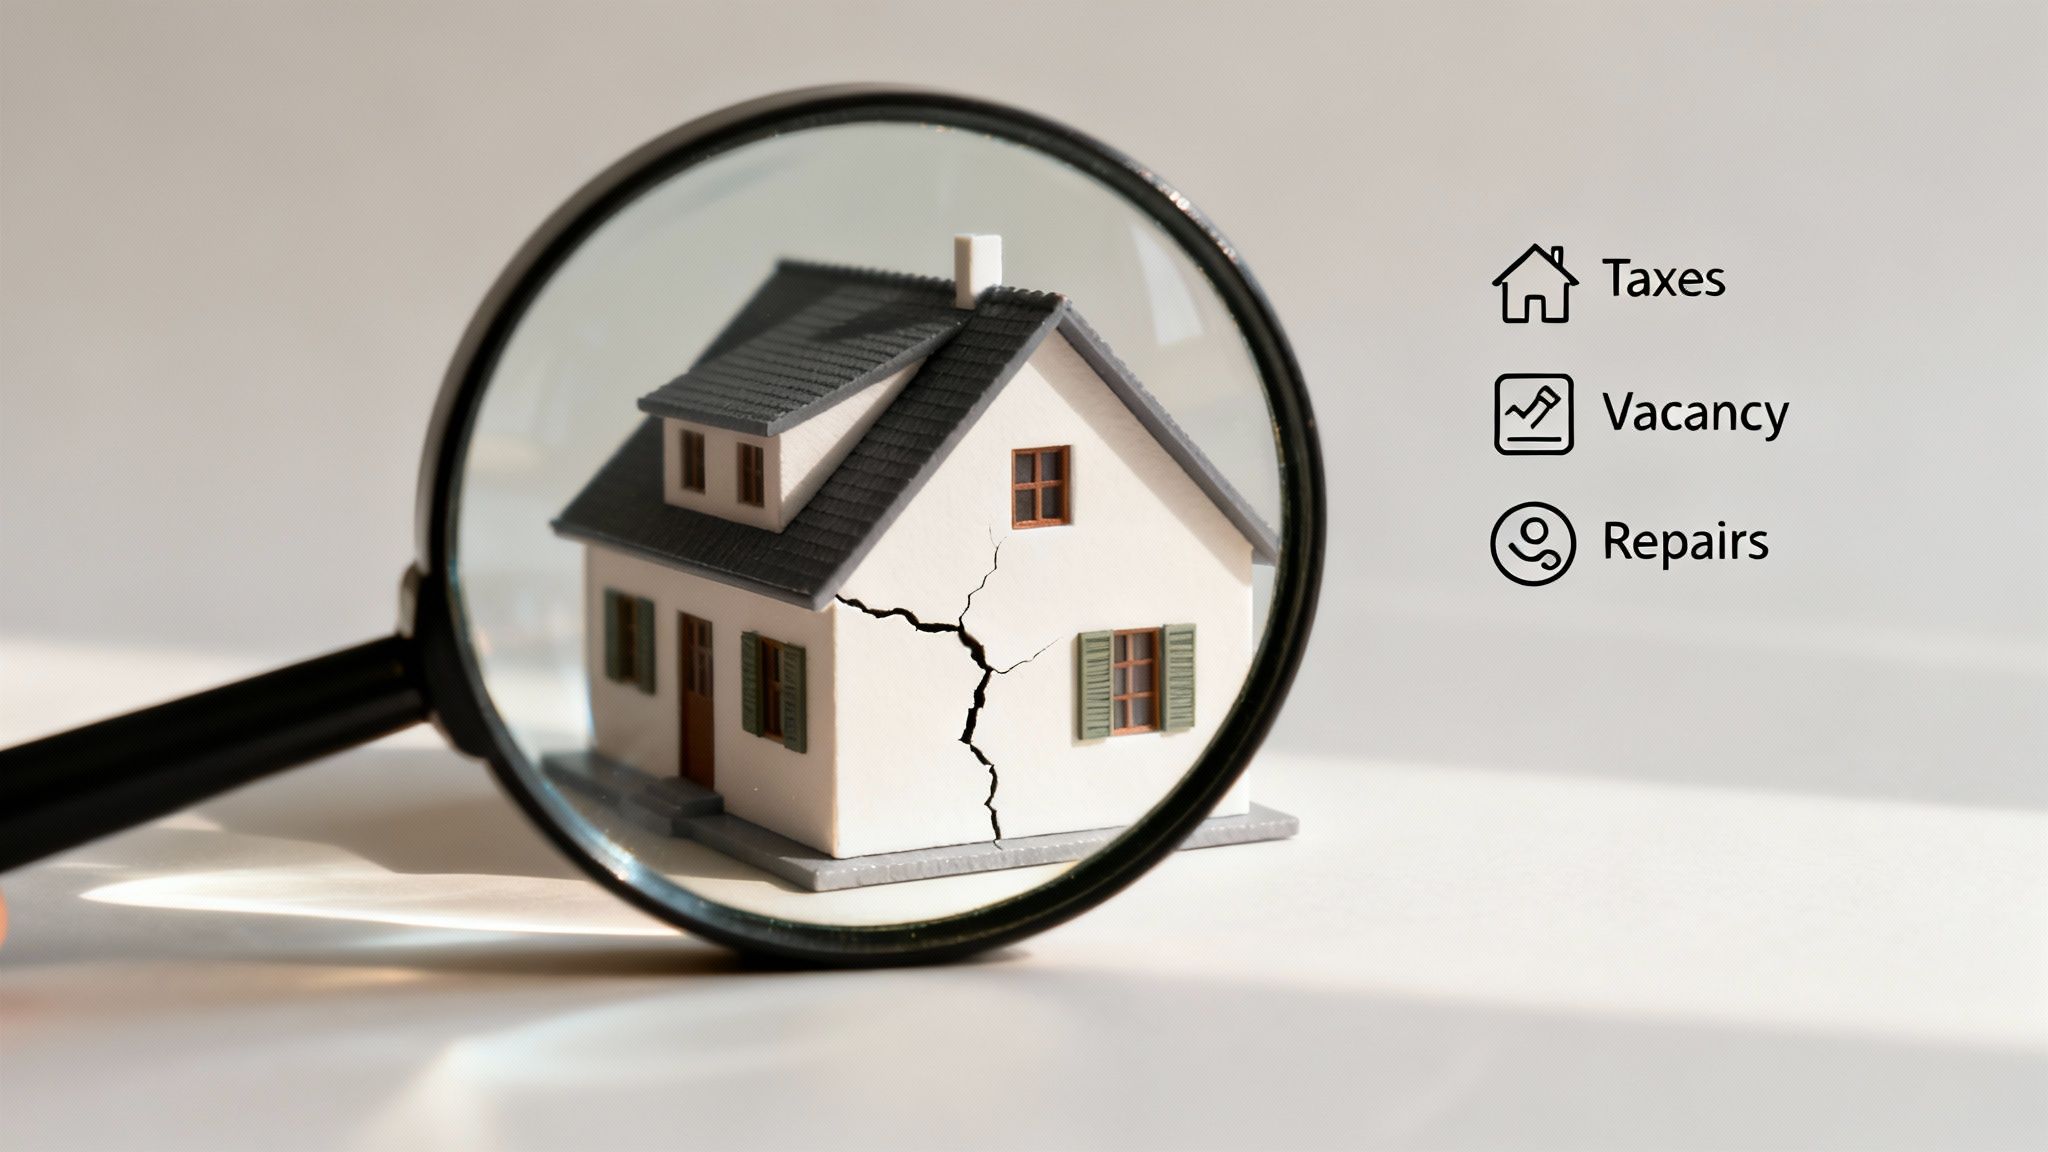
- Operating Expenses: These are the ongoing, non-negotiable costs of owning a property. Think property taxes, homeowners insurance, HOA fees, and routine maintenance. To get a real handle on everything involved, check out this deep dive into what are carrying costs in real estate.
- Vacancy Rates: A property doesn't generate income when it's empty between tenants. A 5% vacancy rate (about 18 days a year) is a common estimate, but this can vary wildly based on your local market and the property's condition.
- Major Repairs: The ratio has no line item for a new roof in five years or a water heater that gives out unexpectedly. Smart investors set aside a portion of rent each month—often called a capital expenditure (CapEx) fund—for these big-ticket items.
The Appreciation And Market Context Puzzle
Beyond direct costs, the ratio also misses the bigger picture of market dynamics and appreciation. Take a market like Greater London, where the price-to-rent ratio soared by 153% between 1997 and 2018. This was driven by intense demand and limited housing supply, which completely changed rent growth expectations.
In these supply-restricted areas, a surge in demand can cause the ratio to climb for years. This makes properties look expensive based on current rents but potentially lucrative because of future appreciation. You can discover more about these housing market dynamics and their long-term effects.
Ultimately, the rent-to-value ratio is a starting point, not a finish line. It helps you quickly spot properties with strong income potential, but it’s the deeper dive into expenses, vacancies, and market trends that will reveal a truly great investment.
Frequently Asked Questions for Home Buyers
Diving into real estate metrics can bring up a few questions. Here are answers to common concerns to help you analyze properties with confidence.
Is a low rent-to-value ratio always a bad sign when buying a home?
Not necessarily. A low ratio often means you're looking in a high-demand area where home values are rising quickly. While it might not be a cash-flow superstar if you were to rent it out today, it could be a fantastic long-term investment due to appreciation. If your main goal is to build equity in a growing neighborhood, a lower ratio might be perfectly acceptable.
How does my mortgage payment factor into this?
The rent-to-value ratio doesn't include mortgage payments. It's a quick way to compare the property's income potential against its price, independent of your personal financing. Once you've used the ratio to find a promising property, your next step is to calculate your estimated monthly mortgage payment (including taxes and insurance) to see how it compares to potential rent. This will give you a clearer picture of potential cash flow or how much rent could offset your costs.
How can I find the potential rent for a home I want to buy?
Finding a reliable rent estimate is key. You can start by checking rental listing sites like Zillow or Apartments.com for similar properties in the same neighborhood. Look for homes with the same number of bedrooms, bathrooms, and similar square footage. You can also talk to local real estate agents or property managers, as they have direct knowledge of the current rental market and can provide an expert opinion.
Ready to stop guessing and start analyzing properties like a pro? Flip Smart gives you the tools to calculate key metrics, estimate costs, and uncover profit potential in seconds. Find your next winning investment with Flip Smart today