Before you can tell if a rental property is a profitable investment or a financial headache, you need to know how to run the numbers. The process might seem intimidating, but it really boils down to three key steps: gathering the right financial data, projecting your income and expenses, and calculating the metrics that tell you if the deal actually makes money.
It all starts with a quick filter—a simple test to see if a property is even worth a closer look.
Laying the Groundwork for a Solid Rental Analysis

Before you fire up a spreadsheet, you need a solid foundation. This first stage is about learning to quickly spot the difference between a promising investment and a money pit. It’s where you develop the confidence to pass on weak deals and focus your energy on properties with real potential.
To do this, most seasoned investors lean on a simple, time-tested benchmark to get a quick read on a property's profitability. This is where the 1% Rule becomes an invaluable tool.
What is the 1% Rule?
The 1% Rule is a simple guideline stating that a property's gross monthly rent should be at least 1% of its purchase price. So, a $250,000 property should ideally rent for $2,500 or more per month to be considered a potentially strong deal.
Think of it as your first line of defense. It’s not a hard-and-fast law, but it’s a quick check that tells you if a property has enough income potential to cover the mortgage, pay all the bills, and hopefully leave some cash in your pocket.
If a property can’t even clear this low bar, it's a huge red flag that it might struggle to produce positive cash flow. That’s your signal to move on to the next one without wasting any more time.
Mastering the Initial Screening
Effectively analyzing a rental starts with getting comfortable with that 1% rule. It’s a benchmark investors use everywhere to quickly gauge profitability. For a $200,000 property, that means you're looking for at least $2,000 in monthly rent to feel good about its potential to cover expenses and turn a profit.
With the real estate rental market exploding—projected to jump from $2.91 trillion in 2025 to $3.87 trillion by 2029 at a 7.4% CAGR—rules of thumb like this are critical for sifting through deals quickly. This simple calculation is just one of many essential real estate math formulas investors use to make smarter, faster decisions.
For an even deeper dive right from the start, tools like an AI Real Estate Property Analyzer can offer powerful insights and data-driven recommendations. By setting a clear benchmark with the 1% rule, you’ve already prepared yourself for the more detailed financial metrics we’ll dig into next.
Nailing Down the Real Income and Expenses
Alright, so a property has caught your eye and passed the initial sniff test. Now it’s time to graduate from back-of-the-napkin math and get into the details. This is where profitable investors separate themselves from the hopefuls.
Guesswork has no place in a solid real estate deal. Your success boils down to two critical tasks: projecting realistic income and hunting down every single expense. Get either of these wrong, and that "slam dunk" deal can quickly turn into a money pit. Let's build a real financial picture, starting with the cash coming in.
Determining Realistic Rental Income
First things first: you need to figure out what a property can actually command in rent. Don't take the seller's or listing agent's numbers as gospel. Your job is to become an expert on the local rental market by pulling your own comparable properties, or "comps."
Zero in on rentals that truly mirror your target property:
- Size and layout: A three-bed, two-bath home rents for more than a three-bed, one-bath. Compare apples to apples.
- Condition and amenities: Does it have a fresh remodel, a garage, or a fenced-in yard? These details matter and directly influence what a tenant will pay.
- Location: Keep your search hyper-local—within a few blocks is ideal, a half-mile radius at most. Rents can swing wildly from one side of a major road to the other.
Use sites like Zillow or Apartments.com to find similar listings. Don't just look at the asking rent; check how long the listing has been active. If a place has been sitting vacant for 60 days, it's a huge red flag that it's overpriced.
Quick Takeaway: Call a few local property managers and ask a simple question: "If I bought a clean three-bedroom, two-bath house in this neighborhood, what rent could I realistically expect to get for it?" Their on-the-ground knowledge is often pure gold and far more accurate than any online tool.
Uncovering the Full Spectrum of Expenses
Income is the fun part, but expenses are what actually determine your profit. The single biggest mistake new investors make is only accounting for the mortgage payment. To truly understand how to analyze a rental property, you need a complete picture of your operating costs.
A helpful guideline is the 50% Rule. This rule of thumb suggests that about half of your gross rental income will be eaten up by operating expenses—and that's before you even touch the mortgage payment. If a property brings in $2,000 a month in rent, you should set aside around $1,000 for everything else.
While the 50% Rule is a great gut check, a serious analysis demands that you itemize every single cost.
Building Your Expense Checklist
Let's break down the expenses you absolutely cannot ignore. Your mortgage (principal and interest) is just the tip of the iceberg.
Core Operating Expenses:
- Property Taxes: Look this up on the county assessor's website. A word of caution: if you're buying the property for much more than its current assessed value, expect your tax bill to jump post-sale.
- Insurance: Don't guess. Call an insurance broker and get a real quote for a landlord policy. The cost can vary dramatically based on location (think flood zones) and the age of the property.
- Property Management Fees: Planning to self-manage? Great—but you should still budget for this. A typical fee runs 8-10% of the monthly rent. Including it keeps your numbers honest and gives you the option to hire out management later without wrecking your cash flow.
- Repairs and Maintenance: This isn't for a new roof; this is for the leaky faucets and broken garbage disposals. Earmark at least 5-10% of gross rent for these inevitable headaches.
- Vacancy: No property stays rented 100% of the time. Tenants move out. It takes time to find new ones. A conservative vacancy rate of 5-8% of the annual rent (roughly one month's rent) is a safe bet.
Now for the big stuff—the silent killers that sneak up on unprepared landlords.
Capital Expenditures (CapEx):
These are the large, infrequent, but wallet-busting replacements. You need to be saving for them every single month from day one. Think of it as a forced savings account for the property's major components.
| Item | Average Lifespan | Estimated Cost | Monthly Savings Needed (Example) |
|---|---|---|---|
| Roof | 20-25 years | $10,000 | $33 |
| HVAC System | 15-20 years | $8,000 | $33 |
| Water Heater | 10-12 years | $1,500 | $10 |
| Appliances | 10-15 years | $4,000 | $22 |
| Exterior Paint | 7-10 years | $5,000 | $42 |
By meticulously forecasting both your income and this full range of expenses, you move from wishful thinking to a realistic financial model. This detailed budget is the bedrock for the key performance metrics we'll dive into next.
Calculating Your True Cash Flow and Return
After you've meticulously mapped out all the potential income and expenses, it's time for the moment of truth. This is where you connect the dots to see if a property actually makes money. We're going to zero in on two of the most powerful metrics in any real estate investor's toolkit: Cash Flow and Cash-on-Cash (CoC) Return.
These numbers cut through the noise. They move beyond simple income-versus-expense and show you the real-world performance of your investment. Think of it this way: gross rent is just a vanity metric. The real story is told by the cash left in your bank account after every single bill is paid.
What Is Your Real Monthly Profit?
Your pre-tax cash flow is the simplest, most direct measure of a property's health. It's the money you have left over at the end of each month—your actual take-home profit before taxes.
The formula couldn't be simpler:
Total Monthly Income - Total Monthly Expenses = Monthly Cash Flow
Let's put this into action with a realistic scenario. Imagine you're analyzing a single-family home with these numbers:
- Gross Monthly Rent:$2,200
- Total Monthly Expenses:$1,850 (This bundles everything: mortgage, taxes, insurance, and your reserves for vacancy, maintenance, and CapEx)
The math is easy: $2,200 - $1,850 = $350 per month.
That $350 is pure, positive cash flow. Annually, this property would generate $4,200 ($350 x 12). This is the money that goes straight into your pocket, helps you build reserves, or gets you closer to your next investment. For a more detailed breakdown, you can check out our guide on how to calculate cash flow on a rental property.
A common benchmark for new investors is to aim for at least $200-$300 of positive cash flow per door, per month. This provides a healthy buffer for surprises and ensures the property can sustain itself from day one.
Measuring How Hard Your Money Is Working
Positive cash flow is non-negotiable, but it doesn't tell the whole story. A property kicking off $300 a month is great, but how much cash did you have to put down to get that return? This is where the cash-on-cash (CoC) return comes in.
This metric is a favorite among seasoned investors because it measures the performance of the actual cash you pulled out of your pocket to buy the property. It tells you exactly how hard your invested capital is working for you, which makes it an incredibly powerful tool for comparing different deals.
Here's the formula:
(Annual Cash Flow / Total Cash Invested) x 100 = Cash-on-Cash Return (%)
Your "Total Cash Invested" isn't just the down payment. It's every penny you spend to get the deal done and the property rent-ready. This includes:
- Down Payment
- Closing Costs (typically 2-5% of the purchase price)
- Initial Repair or "Make-Ready" Costs
Let's stick with our example property, which has a purchase price of $280,000.
- Down Payment (20%):$56,000
- Closing Costs (3%):$8,400
- Initial Repairs:$3,000
- Total Cash Invested:$67,400
With an annual cash flow of $4,200, the CoC return calculation looks like this:
($4,200 / $67,400) x 100 = 6.2%
Is 6.2% a good return? That depends entirely on your goals and your market. Many investors target a CoC return between 8% and 12%, but a lower return might be perfectly acceptable in an area poised for high appreciation.
The cash-on-cash return (CoC) metric is especially critical now. The global rental market is projected to hit $2.904 trillion in 2025, and with shifting economic conditions—like US 30-year mortgage rates expected to be around 6.19% by late 2025—understanding a deal's true profitability is more important than ever.
For a clearer picture, here is a table breaking down how to calculate the Cash-on-Cash Return.
Sample Cash-on-Cash Return Calculation
| Financial Item | Calculation/Value |
|---|---|
| Purchase Price | $280,000 |
| Down Payment (20%) | $56,000 |
| Closing Costs (3%) | $8,400 |
| Initial Repairs | $3,000 |
| Total Cash Invested | $67,400 |
| Annual Gross Rent ($2,200 x 12) | $26,400 |
| Annual Expenses ($1,850 x 12) | $22,200 |
| Annual Cash Flow | $4,200 |
| Cash-on-Cash Return (%) | ($4,200 / $67,400) x 100 = 6.2% |
This step-by-step breakdown clearly shows how the 6.2% return is derived from the initial investment and the property's ongoing performance.
Why Your Down Payment Is a Game Changer
Your financing choices have a massive impact on your returns. It's a bit of a balancing act. A larger down payment reduces your monthly mortgage, which in turn boosts your monthly cash flow. But, it also increases your total cash invested, which can push your cash-on-cash return down.
Let's see what happens if you bought that same property with a lower 10% down payment (assuming you could get that loan).
| Financial Metric | 20% Down Payment | 10% Down Payment |
|---|---|---|
| Purchase Price | $280,000 | $280,000 |
| Down Payment | $56,000 | $28,000 |
| Total Cash Invested | $67,400 | $39,400 |
| Monthly Mortgage (P+I) | ~$1,337 | ~$1,504 |
| Monthly Cash Flow | $350 | $183 |
| Annual Cash Flow | $4,200 | $2,196 |
| Cash-on-Cash Return | 6.2% | 5.6% |
Note: Loan terms are illustrative.
In this case, putting less money down actually decreased both the monthly cash flow and the CoC return. This is often because a smaller down payment can trigger higher interest rates or private mortgage insurance (PMI). However, in some situations, using more leverage (a lower down payment) can increase your CoC return if the cash flow doesn't drop as sharply. This is exactly why it's so important to run the numbers for different financing scenarios when you analyze a rental property.
Using Cap Rate to Compare Different Properties
Once you've nailed down cash flow and your cash-on-cash return, you've got a great handle on how a single property performs with your specific financing. But what about when you're weighing two totally different deals? How do you compare a duplex in one city against a single-family home in another?
You need a way to level the playing field. That's where the Capitalization Rate, or Cap Rate, comes in.
This is easily one of the most important metrics in real estate investing because it evaluates a property’s raw, unleveraged earning power. It strips away the mortgage to show you how the asset performs on its own, making it the perfect tool for an apples-to-apples comparison.
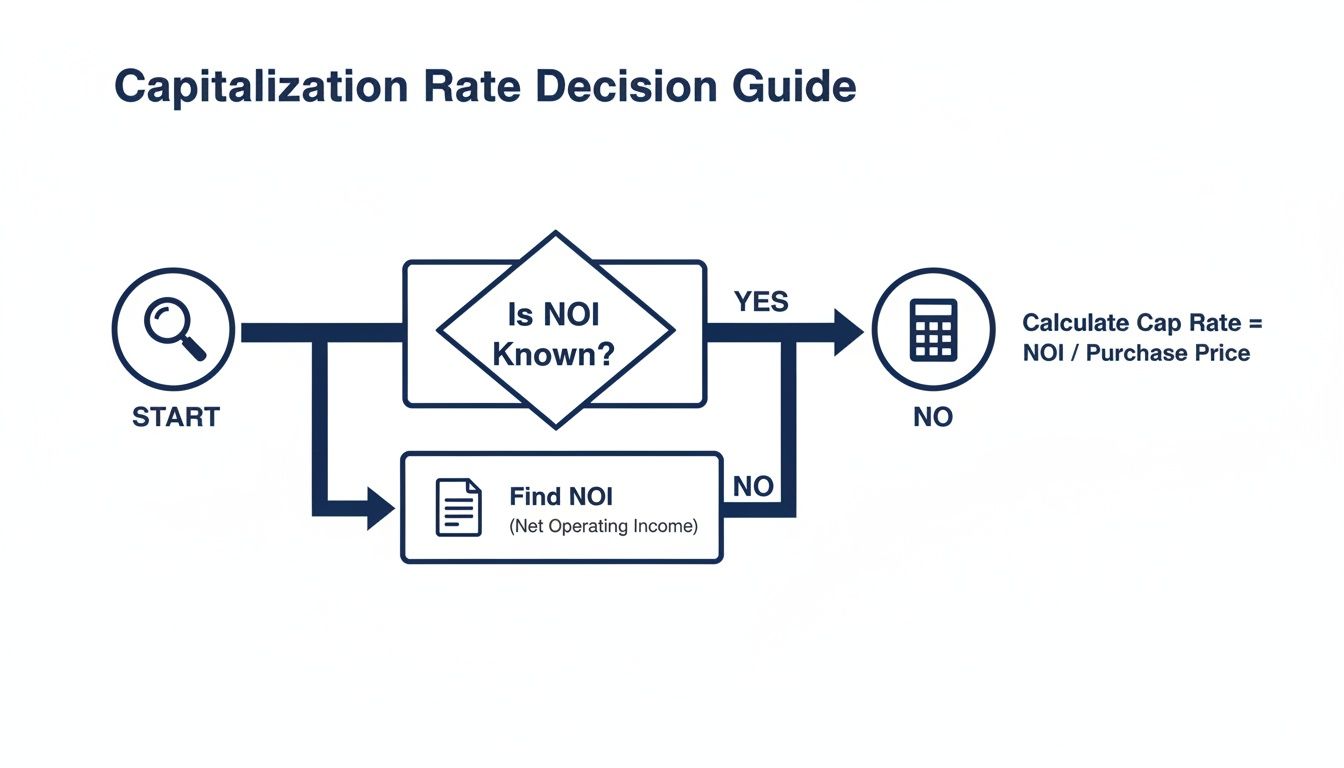
First, You Need to Find the Net Operating Income
Before you can touch cap rate, you have to figure out the property's Net Operating Income (NOI). This is a simple but critical number that shows you the property's total annual profit before factoring in any loan payments.
Just remember: NOI does not include your mortgage payment (principal and interest). It’s purely a measure of the property's ability to generate cash from its own operations.
The formula couldn't be easier:
Gross Rental Income - Operating Expenses = Net Operating Income (NOI)
Let's stick with our running example: a property with $26,400 in annual gross rent and operating expenses (taxes, insurance, maintenance, etc.) of $9,840.
$26,400 - $9,840 = $16,560 (NOI)
That $16,560 is the pure profit the property spits out each year, before the bank gets its cut.
Calculating and Making Sense of the Cap Rate
With your NOI in hand, calculating the cap rate is just one more simple step.
Here’s the formula:
Net Operating Income (NOI) / Property Purchase Price = Cap Rate (%)
Using our example property with a $280,000 price tag and an NOI of $16,560:
$16,560 / $280,000 = 0.059, or a 5.9% Cap Rate
Okay, but what does 5.9% actually mean? The cap rate is a direct reflection of market sentiment, risk, and potential return. If you want to go deeper, this is a great breakdown of what is cap rate in real estate and how it shapes investment choices.
- Lower Cap Rates (think 3-5%): You'll see these in high-demand, stable markets like New York or San Francisco. A low cap rate means investors are willing to pay a premium for safety and appreciation potential. The asset is seen as lower-risk.
- Higher Cap Rates (think 8-12%+): More common in smaller towns or up-and-coming neighborhoods. A high cap rate suggests the property is an income-generating machine for its price, but it might come with higher risks, like more vacancy or slower appreciation.
The cap rate is your go-to metric for an unbiased snapshot of a rental's potential. A healthy range in many markets is often between 6-10%, which usually strikes a nice balance between current yield and future growth.
Putting Cap Rate to Work in a Real Decision
Now for the fun part. Let's say you're trying to choose between two different properties:
- Property A (Our Example): A single-family home in a stable suburb. Price: $280,000. NOI: $16,560. This gives it a Cap Rate of 5.9%.
- Property B: A duplex in an up-and-coming neighborhood in a smaller city. Price: $220,000. NOI: $18,700.
First, let's run the numbers for Property B:
$18,700 / $220,000 = 8.5% Cap Rate
Now we can compare them side-by-side.
| Metric | Property A | Property B |
|---|---|---|
| Purchase Price | $280,000 | $220,000 |
| Net Operating Income (NOI) | $16,560 | $18,700 |
| Cap Rate | 5.9% | 8.5% |
Instantly, you can see that Property B offers a significantly higher return on a pure, unleveraged basis. Does that automatically make it the "better" deal? Not necessarily. That higher 8.5% cap rate might reflect more risk in that particular market.
But it immediately tells you that Property B is a more efficient income-producing asset for the price. This kind of clarity is exactly why understanding the rental property cap rate is non-negotiable for serious investors.
Ultimately, the "right" cap rate comes down to your personal strategy. Are you hunting for maximum cash flow today (favoring a higher cap rate), or are you playing the long game for stability and appreciation (favoring a lower cap rate)? By using this metric, you can cut through the noise and confidently compare any two deals.
Preparing Your Investment for the Unexpected
Even the most buttoned-up analysis is built on a foundation of assumptions. You assume a certain rent, you budget for predictable maintenance, and you cross your fingers for minimal vacancy.
But what happens when reality decides to throw a wrench in your spreadsheet? Smart investors don't just hope for the best; they build a battle plan for the worst.
This is where you need to stress-test your numbers. Think of it as a financial fire drill for your deal. By intentionally poking holes in your own projections, you find out just how resilient the investment is before your own money is on the line.
Running a Sensitivity Analysis
A sensitivity analysis sounds complicated, but it's a simple, powerful concept. You just change one key variable at a time in your financial model to see how it impacts your bottom line—specifically your cash flow and returns.
It’s all about answering the critical "what-if" questions before you sign anything.
What happens to your profit if the property sits empty for three months instead of the one you planned for? How does a surprise $5,000 HVAC replacement affect your annual return? This is what separates a static spreadsheet from a dynamic, real-world risk assessment.
By modeling a few different outcomes, you can pinpoint the exact breaking point of an investment. This isn't about being a pessimist; it's about being a prepared professional.
Building Your Best-Case and Worst-Case Scenarios
The most effective way to put your deal through the wringer is to create three distinct scenarios: your most likely, the worst case, and the best case. Your initial analysis is your "most likely" scenario—it's what you realistically expect to happen based on good data.
Now, let's get a little creative and build out the other two.
Key Variables to Stress-Test:
- Vacancy Rate: What if it takes three months to find a good tenant instead of one? Jack your budgeted vacancy rate up from 8% to 25% for the year and watch what happens to your cash flow.
- Rental Income: The market softens, and you have to drop the rent by $200 a month to get it filled. How does that change the math?
- Major Repairs: Plug in a big, ugly, one-time expense. Model a $7,000 roof repair or a $4,000 main sewer line clog and see how it impacts your annual cash-on-cash return.
- Property Taxes: The county reassesses the property's value after you buy it (they always do), and your taxes jump. What if they go up by 20%?
Let's plug this into a real-world example. Say your "most-likely" projection shows a respectable $300 monthly cash flow.
| Scenario | Vacancy Assumption | Major Repair Cost | Adjusted Monthly Cash Flow |
|---|---|---|---|
| Most-Likely | 8% (1 month) | $0 | $300 |
| Worst-Case | 25% (3 months) | $5,000 | -$267 |
| Best-Case | 0% (No vacancy) | $0 | $475 |
In this worst-case scenario, that brutal combination of a long vacancy and a surprise repair doesn't just erase your profit—it puts you $267 in the hole each month. Knowing this number upfront is incredibly valuable. It tells you exactly how much cash you need in reserves to ride out a tough year without panicking.
This kind of analysis all starts with a solid understanding of your Net Operating Income (NOI). It's the engine of all your return calculations.
Before you can accurately stress-test your returns, you have to nail down your NOI. This proactive risk assessment is what turns you from a passive buyer into a strategic investor who's ready for anything the market throws at them.
Frequently Asked Questions
After crunching the numbers, it's natural to have a few more questions. Here are answers to some of the most common concerns for new investors.
What’s the single most important metric to watch?
While all metrics tell a part of the story, most seasoned investors focus on the Cash-on-Cash (CoC) Return. It’s the most honest measure because it tells you how hard your actual invested money is working for you. A positive cash flow is the minimum requirement, but CoC return shows the efficiency of your investment. Aiming for a CoC return between 8% and 12% is a solid goal in many markets.
How much should I budget for repairs and maintenance?
Underestimating repairs is a classic rookie mistake. A good rule of thumb is to set aside 1% of the property's purchase price annually for routine maintenance (e.g., $2,500 per year for a $250,000 house). On top of that, you must save for Capital Expenditures (CapEx)—the big-ticket items like a new roof or HVAC system. Ignoring CapEx is a surefire way to face a financial crisis down the road.
What are the biggest mistakes new investors make?
The two biggest mistakes are rooted in over-optimism. First is underestimating expenses; new investors often forget to budget for vacancy, property management, and small repairs, which erodes profit. The second is failing to do hyper-local market research. You can't rely on online estimates alone. You must research actual rental comps in the specific neighborhood to determine a realistic rental income.
What is the difference between cash flow and cap rate?
Cash flow is the actual profit left in your pocket each month after paying all bills, including your mortgage. It's a measure of personal profitability. Cap rate, on the other hand, measures the property's profitability without considering your specific loan. It helps you compare the raw earning potential of different properties on an apples-to-apples basis, regardless of financing.
Ready to stop guessing and start analyzing properties like a pro? Flip Smart gives you the tools to evaluate any deal in seconds. Get instant valuations, renovation cost estimates, and comprehensive profit reports that take the guesswork out of investing. Make your next move with data-driven confidence. Analyze your first deal for free on flipsmrt.com.