If you're serious about building wealth in real estate, you have to know the numbers. The core math formulas—from Cap Rate to Cash-on-Cash Return—are what separate professional investors from hopeful speculators. They are the essential tools that allow you to strip away emotion and see a property for what it truly is: a financial asset with predictable performance. This guide gives you the actionable insights to use these formulas to find and fund profitable deals.
Why Numbers Are Your Most Powerful Investment Tool
Trying to invest in property without understanding the math is like flying a plane blind. A great location and fresh paint are appealing, but they don't pay the bills and certainly don't guarantee a profitable deal. You need to look under the hood.
The real power comes from using a few key real estate math formulas to analyze a property's financial health before you put a single dollar at risk. These calculations are the universal language of successful investors, enabling you to make data-driven decisions that build a strong portfolio.
From Guesswork to a Predictable Strategy
When you master these formulas, you stop guessing and start making strategic, data-driven decisions. Instead of just feeling like a deal is good, you can prove it with hard numbers. This analytical approach gives you a massive edge.
- See the True Profit: Formulas like Net Operating Income (NOI) cut through the hype to show you a property’s actual profitability.
- Compare Apples to Apples: Metrics like the Capitalization Rate let you stack up completely different properties—a small duplex versus a large apartment building—on a level playing field.
- Dodge Costly Bullets: By running the numbers upfront, you can spot overpriced deals and underperforming assets before they drain your bank account.
- Negotiate with Confidence: Nothing gives you more leverage at the negotiating table than knowing your numbers cold. It shows you're a serious professional who can't be pushed around.
Think of each formula as a specialized diagnostic tool. One tells you about the property's core health (NOI), another about its value in the current market (Cap Rate), and yet another about what you personally get back in your pocket (Cash-on-Cash).
Before we dive into the specific calculations, here’s a quick cheat sheet to keep the key formulas straight.
Your Real Estate Math Cheat Sheet
This table gives you a quick overview of the essential formulas we'll cover in this guide. Think of it as your quick-reference tool for understanding what each calculation tells you and when you should use it.
| Formula Name | What It Reveals | When to Use It |
|---|---|---|
| Cap Rate | The property's unleveraged rate of return | Comparing different properties regardless of financing |
| Cash-on-Cash Return | Your personal return on the actual cash invested | Evaluating how hard your own money is working for you |
| Net Operating Income (NOI) | The property's profitability before debt and taxes | Assessing the core operational health of a property |
| Return on Investment (ROI) | The total return, including equity, over time | Measuring the overall long-term performance of an asset |
| Gross Rent Multiplier (GRM) | A quick valuation based on gross rental income | Getting a fast, high-level estimate of a property's value |
This guide is your practical toolkit for analyzing deals like a pro from day one. By framing every decision with these essential calculations, you’re building a solid foundation for long-term wealth. For more deep dives and actionable tips, check out the other resources on the Flip Smart blog.
Calculating Net Operating Income: The Bedrock of Any Deal
Before you can seriously analyze any investment property, you have to get a handle on its Net Operating Income (NOI). Forget your personal financing for a moment. Forget your taxes. The NOI is the purest measure of a property's raw, cash-generating power.
Think of it as the building's annual profit if it were owned free and clear. It’s the foundational number that nearly every other important real estate formula is built upon, making it the true bedrock of your deal analysis.
The calculation itself is pretty straightforward: you take all the money the property brings in and subtract all the costs required to run it. This gives you a clear picture of the asset's financial performance, completely separate from the investor's specific loan or tax situation.
Breaking Down the NOI Formula
Getting an accurate NOI boils down to being disciplined about what you count as income versus what you count as an operating expense. This is a classic tripwire for new investors, and getting it wrong can sink your analysis from the start.
Gross Operating Income (GOI): This is every single dollar the property is capable of producing in a year. It's not just rent checks. You have to include income from laundry machines, parking fees, pet fees, or storage units. Crucially, you must also factor in reality by subtracting an allowance for potential vacancies.
Operating Expenses (OpEx): These are the necessary, day-to-day costs of keeping the property humming along and in good shape. Think property taxes, insurance, property management fees, routine maintenance, repairs, utilities, and any HOA fees. These are the bills you have to pay just to keep the lights on.
This infographic lays out the flow, showing how critical NOI is to the entire process.
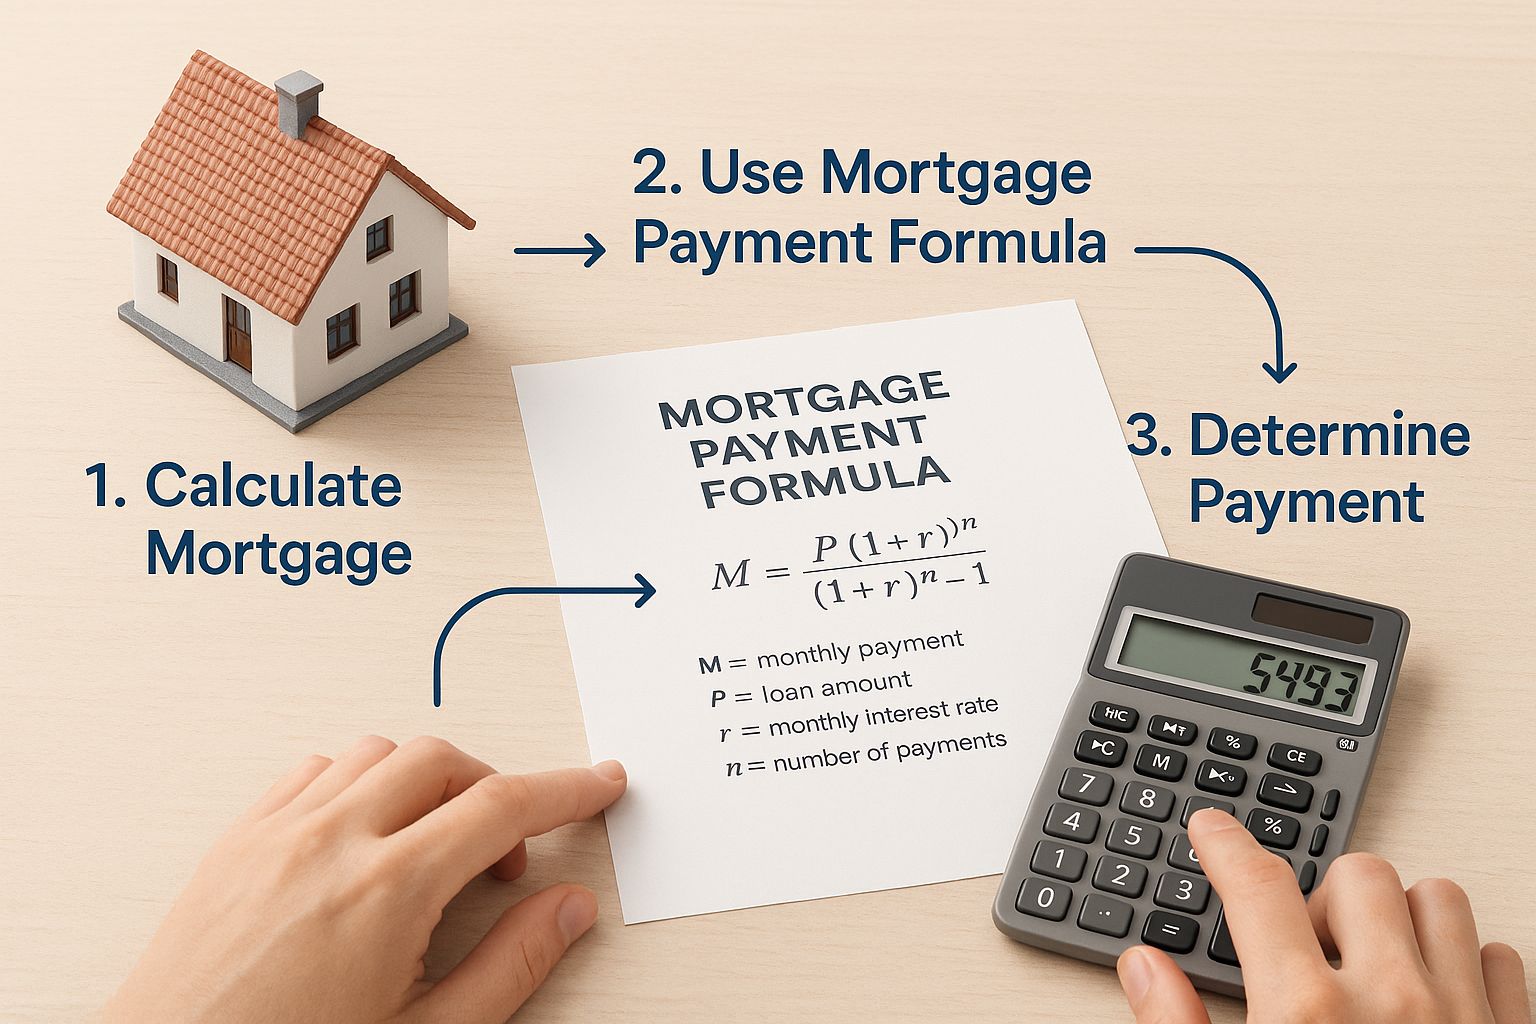
As you can see, disciplined math is what turns a building into a profitable asset, and it all starts here.
What NOI Intentionally Excludes
Just as important is knowing what not to include in your operating expenses. Purposefully leaving these items out is what makes NOI such a powerful tool for comparing different properties on an apples-to-apples basis.
Actionable Insight: Your mortgage payment (principal and interest), capital expenditures (like a new roof), depreciation, and personal income taxes are NOT operating expenses. These are costs tied to your financing, tax strategy, and long-term ownership—not the building's core operational health.
Here’s why that matters. Imagine two investors buy identical side-by-side duplexes. Investor A pays all cash. Investor B gets a mortgage. Their monthly payments are completely different, but the NOI for both properties should be exactly the same. The buildings themselves perform identically, and that's what NOI is designed to measure.
Mastering the NOI calculation is the non-negotiable first step. It ensures you’re evaluating a property on its own merits, giving you the solid foundation you need for more advanced analysis, like figuring out the Cap Rate.
Using the Gross Rent Multiplier for Quick Comparisons
When you’re staring at a list of dozens of potential investment properties, you need a fast way to cut through the clutter. This is where the Gross Rent Multiplier (GRM) comes in. It’s one of the simplest, most effective real estate math formulas for that first-pass filter.
Think of GRM as a quick-and-dirty benchmark. It’s a "back-of-the-napkin" calculation that tells you how a property's price stacks up against its raw income potential. You don't need to know a thing about operating expenses, taxes, or vacancies—just the list price and the total rent it brings in.

How to Calculate Gross Rent Multiplier
The formula is refreshingly simple, giving you a quick gut check on whether a property’s asking price is in the right ballpark for its income. Investors use it constantly to see how many years it would take for the gross rent to pay for the property itself.
The calculation is just: Gross Rent Multiplier = Property Price / Gross Annual Rental Income.
For example, a property listed at $450,000 that generates $30,000 in gross annual rent has a GRM of 15. Simple as that. You can find more detail on how pros apply this formula over at luxurypresence.com.
Let's put it into practice with a real-world comparison.
- Property A: Priced at $300,000 with a gross annual rent of $30,000.
- Property B: Priced at $320,000 with a gross annual rent of $35,000.
At first glance, Property B might seem more attractive because it generates more rent. But the GRM tells a different story.
Property A Calculation: $300,000 / $30,000 = GRM of 10Property B Calculation: $320,000 / $35,000 = GRM of 9.14
This quick analysis flips the script. It shows that Property B, despite its higher price tag, actually offers a better initial value. You're paying less for each dollar of rent it produces. Generally, a lower GRM points to a more promising opportunity.
Know the Limits of GRM
While GRM is a fantastic tool for initial screening, it’s a blunt instrument. You have to understand its limitations.
The formula completely ignores critical operating expenses—things like property taxes, insurance, maintenance, and vacancy rates. These costs can vary wildly from one property to the next. Two buildings with the exact same GRM could have drastically different bottom lines.
Actionable Insight:Never make a final investment decision based on GRM alone. It’s a starting point, not the finish line. Use it to quickly sift through listings and build a shortlist of properties that deserve a deeper dive. Once a property passes the GRM test, it's time to roll up your sleeves and run the numbers with more precise formulas like Net Operating Income (NOI) and Cash-on-Cash Return.
Unlocking Market Value with the Capitalization Rate
If Net Operating Income (NOI) tells you what's happening inside a property, the Capitalization Rate (Cap Rate) tells you how that property stacks up against the rest of the market. Seasoned investors live and die by this number because it cuts through financing noise to provide a pure, apples-to-apples way to compare deals.
Cap Rate is easily one of the most powerful real estate math formulas for sizing up risk and potential return. It lets you look at a small duplex in one part of town and a ten-unit building across the city and evaluate them on a level playing field.
At its core, Cap Rate answers one simple question: "If I paid all cash for this property, what would my annual return be?"
The Cap Rate Formula Explained
The calculation is refreshingly simple. It directly connects a property's income to its price tag, spitting out a clean percentage that represents its unleveraged return.
The formula is just: Cap Rate = Net Operating Income (NOI) / Current Market Value (or Purchase Price)
Let's say an apartment building is on the market for $1,000,000 and its annual NOI is $50,000. The Cap Rate is 5% ($50,000 / $1,000,000). This means the property kicks back a 5% return on its value each year, long before you ever think about a mortgage.
Using Cap Rate for Smarter Comparisons
This is where the magic happens. Let's see how Cap Rate helps you decide between two totally different properties.
- Property A: A single-family rental with an NOI of $12,000 and a price of $240,000.
- Property B: A small commercial building with an NOI of $40,000 and a price of $1,000,000.
At first glance, it's tough to know which is the better opportunity. But when you run the numbers, the picture becomes crystal clear.
Property A Calculation: $12,000 / $240,000 = 5.0% Cap RateProperty B Calculation: $40,000 / $1,000,000 = 4.0% Cap Rate
Suddenly, the comparison isn't so difficult. The Cap Rate immediately shows that Property A generates a higher return relative to its purchase price. This doesn't automatically make it the "winner"—there are always other factors—but it gives you a crucial piece of the puzzle.
What Makes a "Good" Cap Rate?
This is the million-dollar question, and the answer is always: "It depends." A good Cap Rate is entirely relative to the market, the asset class, and your own tolerance for risk.
Here’s a general rule of thumb:
- Lower Cap Rates (e.g., 3-5%): Typically found in high-demand, stable markets (think New York or San Francisco). They suggest lower risk and predictable appreciation but offer weaker initial cash flow.
- Higher Cap Rates (e.g., 8-10%+): Common in emerging neighborhoods, smaller towns, or with riskier property types. They promise higher returns but come with more uncertainty.
Actionable Insight: Once you get a feel for the average Cap Rate in your target area, you can instantly spot deals. A property with a strangely low Cap Rate is likely overpriced. One with an unusually high Cap Rate could be a hidden gem worth investigating further.
Measuring Your True Profit with Cash on Cash Return
While Cap Rate gives you a great high-level view of a property's potential, it misses one critical question for any investor using a loan: "How much money am I actually making on the cash I put into this deal?"
This is where Cash on Cash Return comes in. It's easily one of the most personal and practical real estate math formulas in your entire toolkit. It cuts through the noise and tells you exactly how hard your invested capital is working for you.
Breaking Down the Cash on Cash Return Formula
Cash on Cash Return measures the annual return you get on the actual dollars you pulled out of your own pocket. Forget the property's theoretical performance for a second; this is about your money. It's the ultimate metric for understanding the power of leverage.
The formula itself is simple: Cash on Cash Return = Annual Pre-Tax Cash Flow / Total Cash Invested
To get this right, you have to be dead-on with both halves of that equation. This isn't a ballpark estimate; it's a granular look at your personal investment.
Annual Pre-Tax Cash Flow: This is your Net Operating Income (NOI) after you've paid your mortgage for the year. It's the cash left in your bank account before the tax man comes knocking.
Total Cash Invested: This is every single dollar you spent to get the keys. Think down payment, closing costs, inspection fees, and any immediate repairs you funded out-of-pocket to get the property ready.
This formula is your personal profit scorecard. It moves beyond the property's raw potential (Cap Rate) and focuses on the real-world performance of your investment.
A Practical Example of Leveraged Returns
Let's see how this plays out. Imagine you're buying a duplex for $400,000. After running the numbers, you determine the property's NOI is a solid $20,000 per year.
You're not paying cash, so you get a loan. Here’s what your initial cash investment looks like:
- Down Payment (20%): $80,000
- Closing Costs & Fees: $8,000
- Total Cash Invested: $88,000
Your total mortgage payment for the year (covering both principal and interest) comes out to $15,000.
First, let's figure out your actual annual cash flow: $20,000 (NOI) - $15,000 (Mortgage) = $5,000 in Annual Cash Flow
Now, we can plug that into our Cash on Cash Return formula: $5,000 / $88,000 = 0.0568 or 5.7%
Your Cash on Cash Return is 5.7%. This single number tells you that your $88,000 cash investment is generating a 5.7% return this year.
By forecasting this metric accurately, you can pick deals that actually hit your financial goals. Using tools that provide instant, accurate analysis is key to making faster, smarter decisions. You can check out the Flip Smart pricing plans to see how our platform crunches these numbers for you in seconds.
How the Loan to Value Ratio Shapes Your Financing
Financing is the engine that drives most real estate investments, and the Loan-to-Value (LTV) ratio is the key that turns it on. Think of it as a lender's first line of defense. Before they even pull your credit score, they use this simple calculation to size up their risk in the deal.
It’s just a straightforward comparison between how much you’re borrowing and what the property is actually worth. A lower LTV means you have more of your own money in the deal—more "skin in the game"—which makes lenders feel a whole lot better about giving you their best terms.
Understanding the LTV Formula
The calculation itself is one of the most foundational formulas in real estate, period. It’s used by lenders everywhere to assess risk. You just divide the loan amount by the property's appraised value, and that gives you a percentage.
For example, if a property appraises for $500,000 and you’re taking out a $400,000 loan, your LTV is 80%. That 80% number is a huge benchmark in the lending world, as banks often require investors to stay below it to minimize their exposure.
Let's break down the formula:
LTV = Mortgage Amount / Appraised Property Value
A low LTV ratio (usually anything under 80%) tells lenders you're a lower-risk borrower. This is where you unlock some serious perks.
- Better Interest Rates: Lenders reward lower risk with lower rates. This can save you tens of thousands of dollars over the life of the loan.
- More Favorable Terms: You might get access to more flexible loan products or have certain fees waived.
- Avoiding PMI: This is the big one. Staying under an 80% LTV helps you dodge Private Mortgage Insurance (PMI), a costly extra monthly payment that only protects the lender, not you.
LTV as a Strategic Tool
On the flip side, a higher LTV ratio means you’re using more of the bank's money—you’re maximizing your leverage. While this can definitely amplify your returns, it also dials up the lender's risk, which often triggers that dreaded PMI and can lead to a higher interest rate.
Actionable Insight: The LTV ratio isn't just a number a lender gives you; it's a lever you can control. By adjusting your down payment, you can strategically manage your LTV to secure the best possible financing for your deals.
Understanding how to balance the power of leverage against the costs of a higher LTV is a critical skill. It lets you structure deals that don't just get approved but also perfectly align with your financial goals. When you start viewing LTV as a strategic tool, you can find attractive financing for the investment properties you're analyzing and set yourself up for long-term success.
Answering Your Top Real Estate Math Questions
Look, even after you get the hang of the core real estate math formulas, questions pop up the second you start plugging in numbers from a live deal. It happens to everyone. This section is all about tackling the most common questions I hear from investors, helping you bridge that gap from theory to actually making confident offers.
Which Formula Is Most Important for a Beginner?
If you're just starting out, zero in on the Cash-on-Cash Return. Hands down, it's the most impactful formula for a new investor.
Sure, metrics like NOI and Cap Rate are crucial for sizing up a property's overall health, but Cash-on-Cash Return cuts right to the chase. It answers the one question that matters most to you: "For every dollar I pull out of my own pocket, how much cash will I get back this year?"
It’s a personal, practical metric that ties the deal directly to your bank account. That makes it the perfect starting point for seeing how an investment will actually perform for you in the real world.
How Do I Find Accurate Numbers for My Calculations?
Your calculations are only as good as the numbers you put into them. Garbage in, garbage out. The first step is always to ask the seller for their expense records—specifically, their profit and loss statements—for the last 12-24 months. But never, ever take them at face value.
A great rule of thumb for quickly screening a deal is the 50% Rule. Just assume that your total operating expenses will be about half of your gross rental income. It's a back-of-the-napkin sanity check, not a substitute for real due diligence.
You have to do your own homework and verify everything:
- Insurance: Don't use their number. Call an agent and get your own quotes.
- Property Taxes: Look them up on the county assessor's website. They’re public record.
- Maintenance & Vacancy: The seller's numbers might be unrealistically low. Budget conservatively for both.
Should I Just Use an Online Calculator Instead?
Online calculators are fantastic tools. They're great for running numbers quickly and for double-checking your own math. But you should never, ever rely on them blindly.
Here's why: understanding the formulas yourself is what gives you power. It lets you challenge the inputs and question the outputs. A calculator is just a machine following orders—your orders. If you feed it bad numbers, it will spit out a bad result.
By truly understanding how NOI or Cap Rate works, you can spot when a number looks off, recognize the calculator's built-in assumptions, and confidently run different scenarios. So, use calculators to be efficient, but lean on your own knowledge to make the final call.
Stop drowning in spreadsheets and start making smarter, faster investment decisions. Flip Smart automates the complex math, giving you accurate valuations, rehab costs, and profit projections in seconds. Analyze your next deal with confidence at https://flipsmrt.com.
Article created using Outrank