If you’re just starting to explore real estate investing, you’ve probably heard people talk about "cap rates." When trying to figure out "what is a good cap rate," it’s important to know there isn’t one magic number. A good cap rate is a balance between risk and reward, often falling somewhere between 4% and 10%. But that range is a moving target, shifting with the property's location, its condition, and the overall economic climate.
This guide will walk you through everything you need to know about cap rates, using simple language and practical examples to help you feel confident analyzing your first investment property.
Understanding Cap Rate And Why It Matters
Think of a property's capitalization rate, or cap rate, like a car's miles-per-gallon (MPG) rating. It’s a quick, standardized way to judge an investment’s income-generating potential. Just as MPG tells you how efficiently a car uses fuel, a cap rate tells you how efficiently a property turns its value into profit.
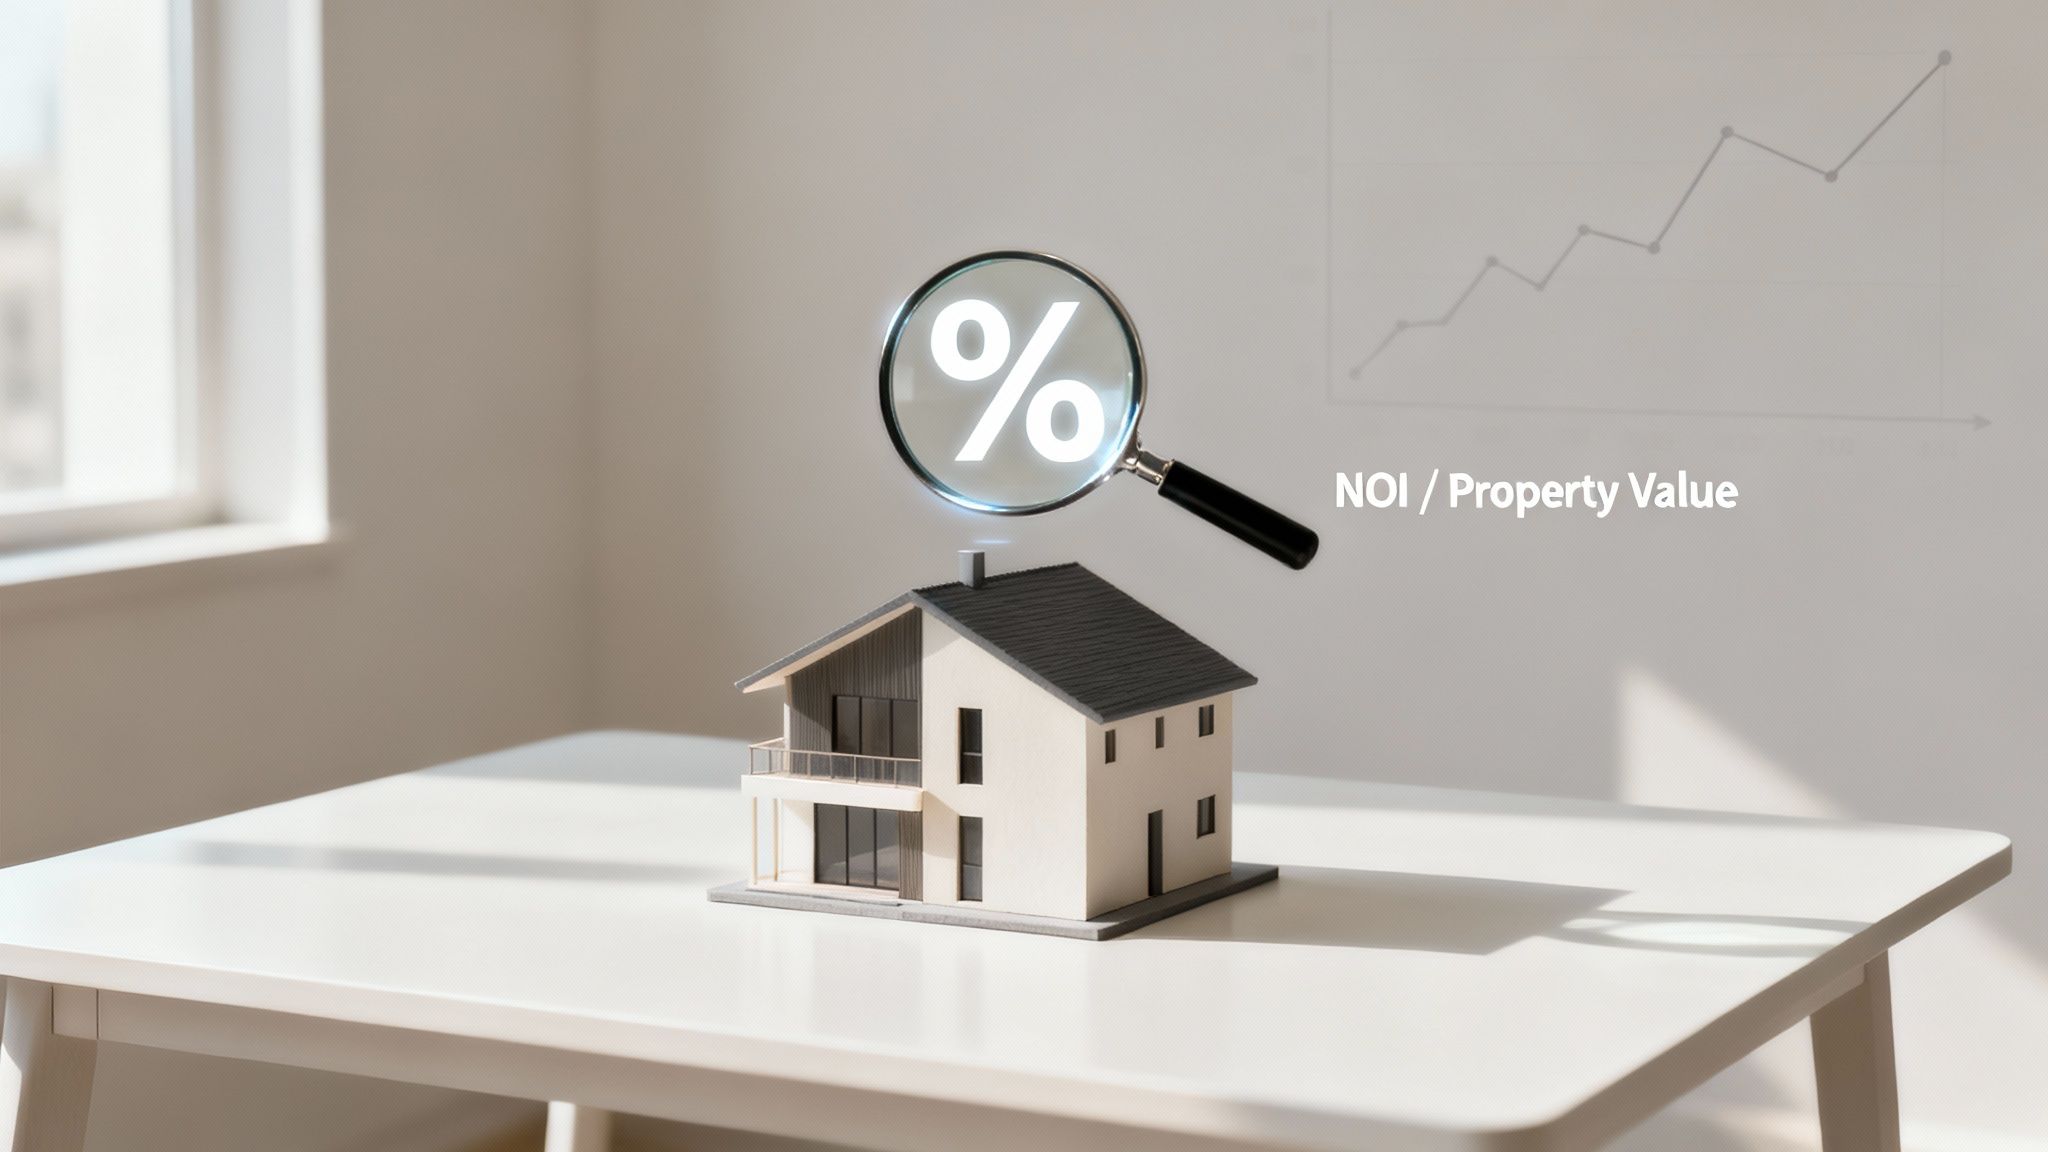
The formula itself is pretty straightforward. You just divide the property's Net Operating Income (NOI) by its purchase price.
Cap Rate = Net Operating Income (NOI) / Property Value
A higher cap rate generally points to a higher potential return on your investment, but it often comes with more risk. On the flip side, a lower cap rate usually signals a safer, more stable property with more modest returns. This metric is a game-changer because it lets you compare different properties on an apples-to-apples basis, no matter the price tag.
What Is Net Operating Income
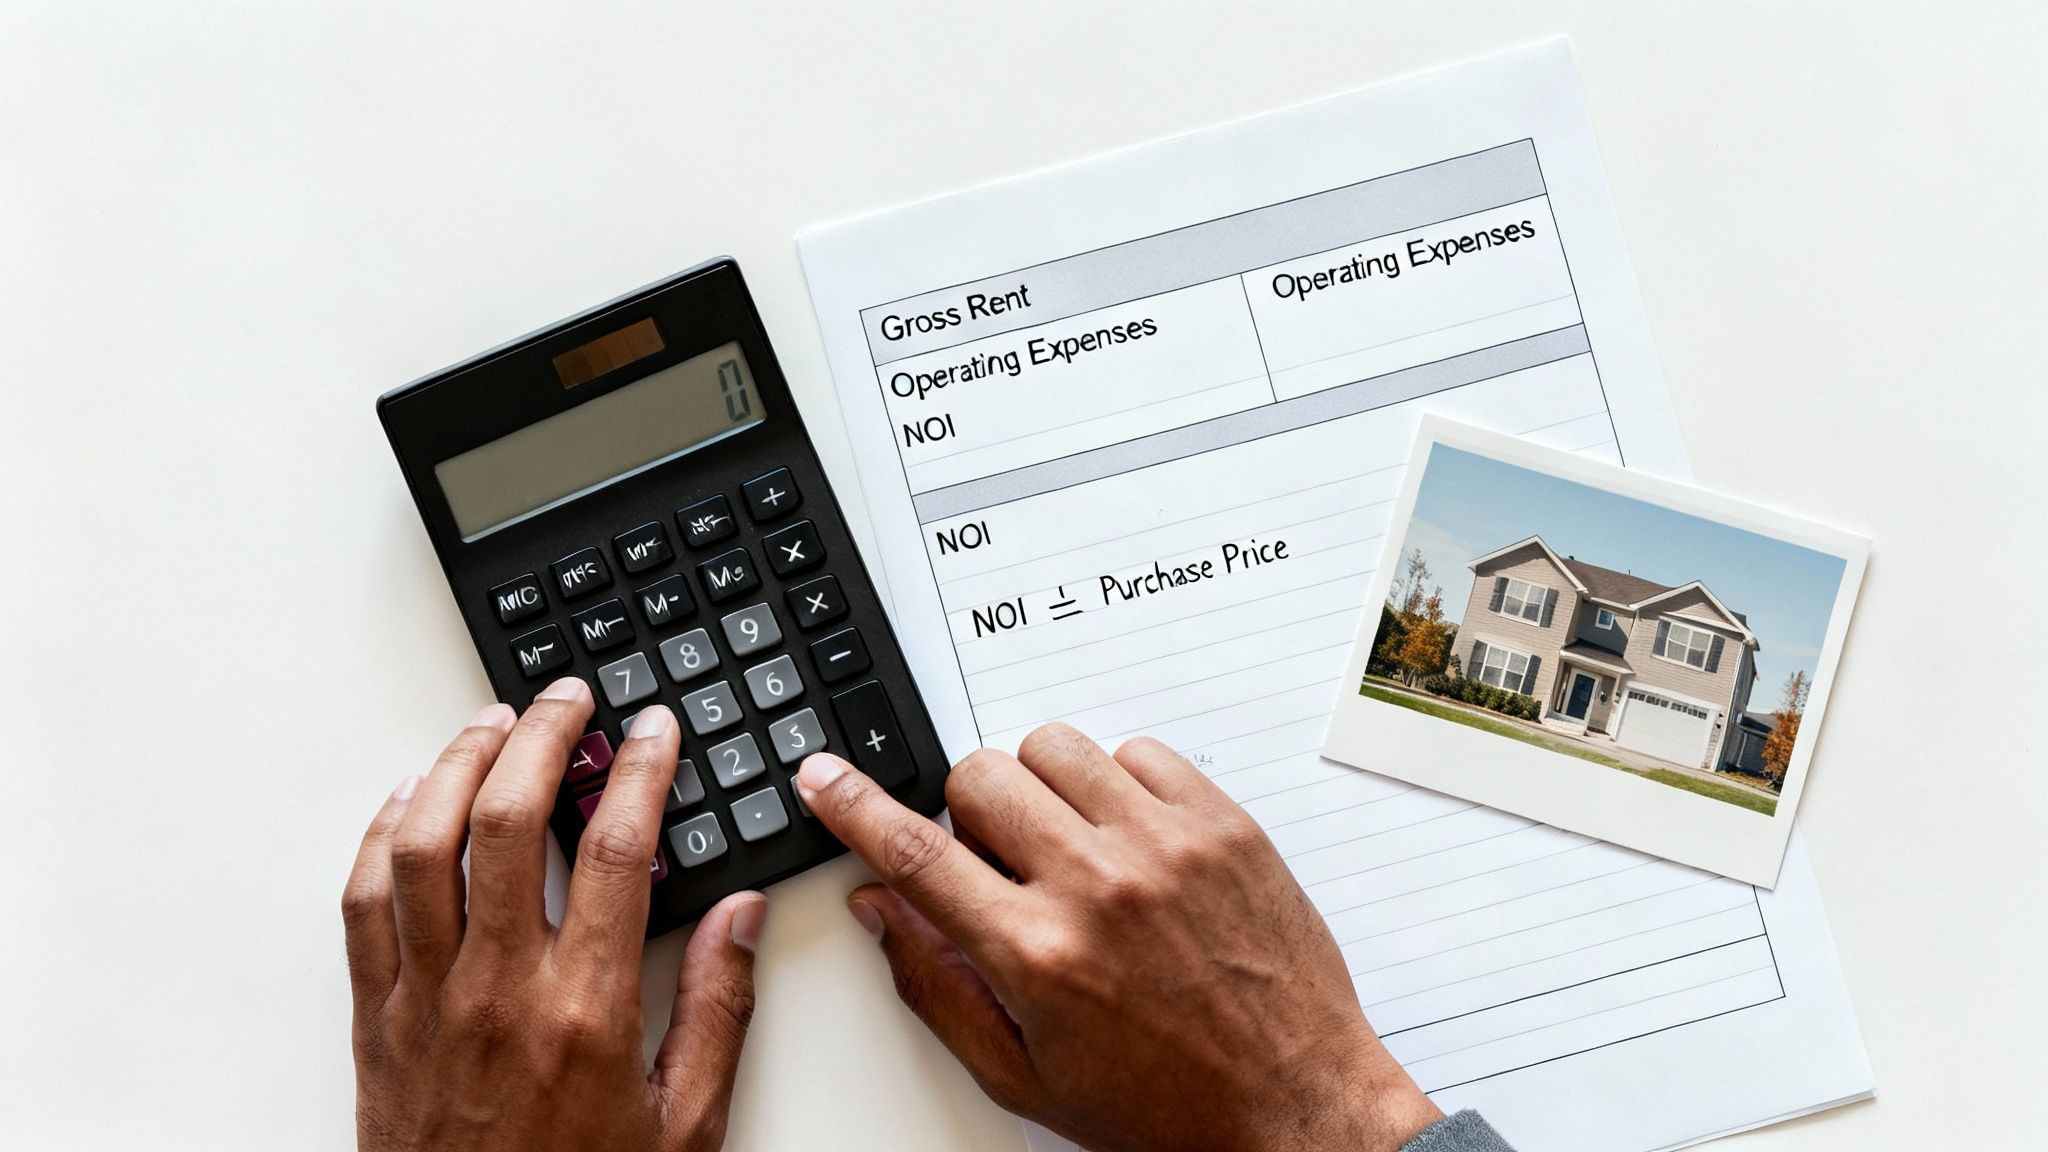
The most critical piece of this puzzle is getting the Net Operating Income (NOI) right. This is where many new investors get tripped up. Your NOI is simply all the money a property brings in over a year, minus all the necessary expenses to keep it running.
To figure out your NOI, you have to be careful about what you include and, just as importantly, what you leave out.
What to include in your NOI calculation:
- Gross Rental Income: The total rent you collect from all your tenants.
- Additional Income: Don't forget fees from parking, laundry machines, or storage units.
- Operating Expenses: These are the day-to-day costs of running the property—things like property taxes, insurance, routine maintenance, repairs, utilities, and property management fees.
What to exclude from your NOI calculation:
- Mortgage Payments: The cap rate is always calculated as if you paid all cash for the property. This helps isolate the property's performance from your personal financing, so loan payments are left out.
- Depreciation: This is a "paper" expense for tax purposes; it doesn’t actually affect your property's cash flow.
- Capital Expenditures: Big, one-time upgrades like a new roof or HVAC system aren't part of the day-to-day operations, so they're excluded from NOI.
Getting this distinction right is the first step toward analyzing deals like a pro. For a deeper dive into the fundamentals, check out this complete guide on what the capitalization rate is and how to apply it. Building this foundation is the key to making smart investment decisions.
How to Calculate Cap Rate With a Real Example
Theory is one thing, but running the numbers on an actual deal makes it all click. Let's walk through a real-world scenario to show you exactly how the cap rate formula works in practice.
Imagine you're looking at a duplex with a $400,000 price tag. We'll break the calculation down into three simple steps. By the end, you'll see how this single percentage gives you a powerful snapshot of the property's earning potential.
Step 1: Tally Your Gross Rental Income
First things first: what's the maximum amount of money this property can bring in over a year? Let's say each side of the duplex rents for $1,500 a month.
- Monthly Gross Income: $1,500/unit x 2 units = $3,000
- Annual Gross Income: $3,000/month x 12 months = $36,000
This $36,000 is your starting line. It’s the total potential rent you could collect if you had zero vacancies all year long.
Step 2: Find Your Net Operating Income
Now for the reality check. No property is 100% occupied, and every property has expenses. To get a realistic picture, we need to subtract all the costs of running the place from our gross income. This gives us the Net Operating Income, or NOI.
Let's pencil out some typical annual expenses, including a conservative 5% vacancy rate—a crucial step many new investors forget.
- Vacancy Allowance (5%): $36,000 x 0.05 = $1,800
- Property Taxes: $4,000
- Insurance: $1,200
- Maintenance & Repairs: $2,000
- Property Management (8%): $36,000 x 0.08 = $2,880
Add those up and you get total operating expenses of $11,880. Now, subtract that from your gross income.
$36,000 (Gross Income) - $11,880 (Total Expenses) = $24,120 (NOI)
Notice that the mortgage payment isn't in this calculation. That's intentional. The cap rate measures the property's performance on its own, completely separate from your financing. For a deeper dive into this, check out this guide on calculating cap rate for rental property.
Step 3: Calculate the Final Cap Rate
This is the final, simple step. Just take your NOI and divide it by the property's purchase price.
- Cap Rate Calculation: $24,120 (NOI) / $400,000 (Purchase Price) = 0.0603
To turn that into the percentage we're all used to seeing, multiply by 100.
The cap rate for this duplex is 6.03%. Now you have a clean, apples-to-apples number you can use to compare this deal against any other investment property on your radar.
Want more practice? Our team put together a detailed guide to help you master how to calculate cap rate using several different scenarios.
Key Factors That Influence a Good Cap Rate
A cap rate is never just a number; its real value comes from the story behind it. A 6% cap rate might be a fantastic deal in one market but a serious red flag in another. To really understand what you're looking at, you have to consider three things: location, property type, and the current market pulse.
These factors are critical because they directly tie into a property's risk and its potential for growth. An investor who just chases the highest cap rate without understanding the why is often walking straight into a trap.
Location and Neighborhood Quality
"Location, location, location" is the oldest cliché in real estate for a very good reason. A building in a bustling, high-demand downtown core will almost always have a lower cap rate than a similar property out in a quiet suburb or a more rural area.
Why is that? It boils down to perceived risk. Investors see that downtown property as a safer bet. It’s likely to have steady tenant demand, lower vacancy rates, and a much better shot at appreciating in value over the long haul. To get that safety and stability, they're willing to accept a lower annual return.
- Low Cap Rate Areas: Think prime city centers or wealthy suburbs with top-tier schools. These spots attract stable, long-term tenants and can command high rents, making them less risky investments.
- High Cap Rate Areas: These are often up-and-coming neighborhoods, smaller towns, or areas with a more uncertain economic future. That higher cap rate is your reward for taking on more risk, like the potential for higher vacancies or slower rent growth.
Property Type and Class
Not all properties are created equal, and their condition has a massive impact on the cap rate. Investors use a simple A-B-C grading system to quickly classify properties based on their age, quality, location, and amenities.
A brand-new Class A apartment complex with modern finishes in a great location will have a low cap rate. It's a premium, low-headache asset. On the flip side, an older Class C property that needs a lot of work will have a much higher cap rate to compensate the new owner for the money and risk they're taking on. For smart investors, understanding how to boost a property's appeal through targeted renovations is key—it's how you can turn a Class C deal into a much more profitable Class B asset by increasing property value.
Market Trends and Economic Forces
Finally, a cap rate is always judged against the backdrop of the current economy. Big-picture market forces, especially interest rates, can make cap rates shift across the entire market.
When interest rates go up, borrowing money gets more expensive. This tends to cool down buyer demand and push cap rates higher, as investors now need a better return to make the deal worthwhile with the increased financing costs.
A solid cap rate for investment properties typically lands between 5% and 10%, but that's a very flexible range. For example, a property with $500,000 in net operating income (NOI) at a 10% cap rate is valued at $5 million—this often signals a higher-risk market. But with a safer 5% cap rate, that same property is suddenly worth $10 million, a scenario you'd see in prime locations when interest rates are low. These shifts prove that what’s considered a "good" cap rate is always changing with the market.
Comparing Cap Rate Benchmarks by Property Type
Knowing the formula for cap rate is one thing, but understanding what makes a number “good” requires context. A good cap rate isn't a universal figure; it changes dramatically depending on the kind of property you're looking at. Each real estate class comes with its own risk profile, and that directly shapes its typical cap rate range.
Think of it this way: a sports car is built for speed, while a minivan is built for safety. In the same way, different properties are designed for different investment outcomes. Knowing the benchmarks helps you instantly spot whether a deal is in line with market expectations or if it's an outlier that needs a much closer look.
The infographic below shows the core factors—location, property type, and market trends—that influence these benchmarks.
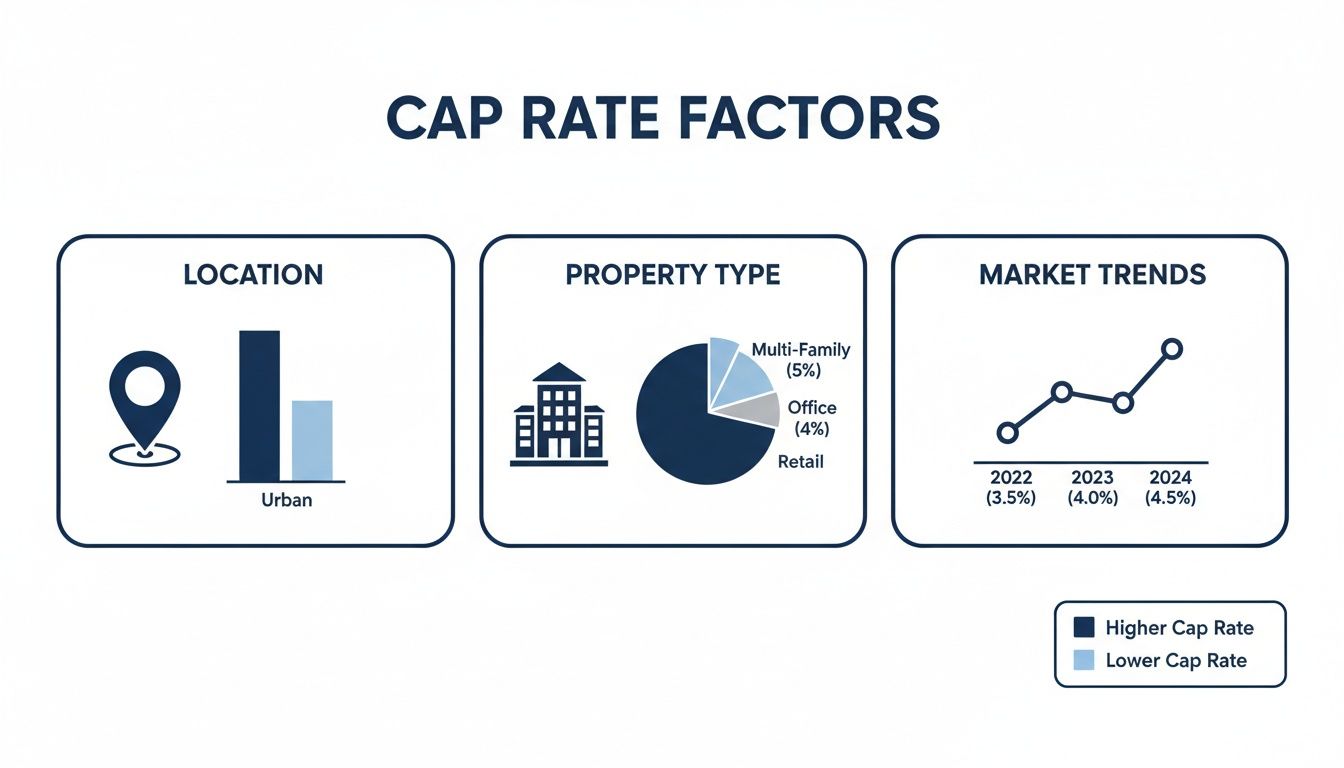
This visual drives home the point that a property’s cap rate is a blend of its physical characteristics and the economic environment it sits in.
Typical Cap Rate Ranges by Property Type
To give you a practical starting point, the table below outlines the typical cap rate ranges for major real estate sectors. Remember, these are just general guides—specific deals can always fall outside these norms depending on unique circumstances.
| Property Type | Typical Cap Rate Range | Key Influencing Factors |
|---|---|---|
| Multifamily | 4% – 7% | Location, tenant quality, vacancy rates, local job growth |
| Industrial | 4% – 6% | E-commerce demand, lease length, tenant creditworthiness, logistics access |
| Retail | 5% – 8% | Anchor tenants, foot traffic, e-commerce competition, consumer spending trends |
| Office | 6% – 9% | Remote work trends, lease terms, building class (A, B, C), local economy |
These ranges show a clear relationship: lower-risk assets like industrial and multifamily properties typically have lower cap rates, while higher-risk assets like office buildings need to offer higher cap rates to attract investors.
Benchmarks for Major Property Types
Let's dig a little deeper into what drives these numbers for each property type.
Multifamily Properties (Apartments): Often seen as the bread and butter of real estate investing, multifamily properties are highly sought after. Why? Because people always need a place to live, which keeps demand relatively stable. This stability leads to lower perceived risk and, as a result, lower cap rates, often landing in the 4% to 7% range. A brand-new apartment building in a prime urban core might even trade for a cap rate below 4%.
Industrial Properties (Warehouses, Logistics): The explosion in e-commerce has turned industrial real estate into a powerhouse. These properties benefit from long-term leases with major corporate tenants, making them incredibly low-risk investments. Because of this high demand and stability, industrial cap rates are typically the lowest of any asset class, often between 4% and 6%.
A lower cap rate in a sector like industrial isn’t a red flag. It’s a sign of high investor confidence and the expectation of steady, reliable income for years to come.
- Retail and Office Properties: These sectors are navigating some serious headwinds, which means they carry more risk. As work-from-home and online shopping trends continue to evolve, retail spaces face tenant turnover and office buildings struggle with vacancy. To compensate investors for taking on this higher risk, the cap rates are naturally higher.
For instance, cap rates for U.S. offices climbed to 6.54% in late 2023, with some forecasts suggesting they could push toward 7.39% as remote work solidifies its place. This is a perfect example of the market pricing in risk. You can explore more data on how market shifts affect real estate rates to see this in action.
By understanding these benchmarks, you can quickly assess if a property's asking price and potential return actually make sense for the level of risk you’d be taking on.
Using Cap Rate with Other Investment Metrics
While cap rate gives you a great, unfiltered look at a property's income potential, it doesn’t tell the whole story. To make truly smart investment decisions, you have to see the bigger picture. This means pairing cap rate with other essential metrics to understand how an investment performs under real-world conditions—especially when financing is involved.
Think of cap rate as the sticker price performance of a car, like its official MPG rating. It's a standard measure, but your actual cost to own and drive it will be very different. By bringing in metrics like Cash-on-Cash Return and Return on Investment (ROI), you get a full financial dashboard for your property.
Cash-on-Cash Return: The Financing Factor
The biggest blind spot of the cap rate is that it completely ignores financing. It’s calculated as if you bought the property with a briefcase full of cash. But since most investors use loans, the Cash-on-Cash Return becomes incredibly important.
This metric answers a simple, crucial question: "For every dollar I actually pull out of my pocket, how much am I getting back each year?" It measures the annual pre-tax cash flow against the total cash you invested.
Cash-on-Cash Return = Annual Pre-Tax Cash Flow / Total Cash Invested
Your total cash invested includes your down payment, closing costs, and any immediate repair expenses. Because it accounts for your mortgage payments, it provides a much more accurate picture of your actual yearly return on the money you've personally committed to the deal. Mastering these calculations is fundamental, and you can explore more essential real estate math formulas to sharpen your analysis.
Return on Investment: The Big Picture
While Cash-on-Cash Return focuses on annual cash flow, Return on Investment (ROI) zooms out to give you the total profitability over the entire time you own the property. ROI includes not just your cash flow but also the equity you build and, most importantly, the property's appreciation in value.
ROI is the ultimate measure of an investment’s success because it captures the full financial gain from the day you buy to the day you sell. It shows you what your initial investment grew into over time. A property with a modest cap rate might turn out to be a home run if it’s in an area with strong appreciation, leading to an excellent overall ROI.
Putting It All Together: A Side-by-Side Look
Let's use our $400,000 duplex example from before, which had a 6.03% cap rate.
Now, let's assume you put 20% down ($80,000) and your annual mortgage payment is $18,000.
Cash-on-Cash Return: Your NOI was $24,120. Subtract the $18,000 mortgage payment to get an annual cash flow of $6,120. Your return on the $80,000 you invested is 7.65% ($6,120 / $80,000).
ROI: If you sell the property in five years for $480,000, your ROI would factor in your total cash flow plus the $80,000 profit from the sale, giving you a complete performance picture.
Each metric provides a unique lens. Cap rate tells you about the property's raw potential, Cash-on-Cash tells you about your yearly return with financing, and ROI tells you the total long-term profit. Using them together is how you find what is a good cap rate for you.
FAQ: Your Top Cap Rate Questions Answered
Even after you've got the basics down, a few questions always seem to pop up for new investors. Getting these cleared up is the last step to feeling truly confident when you're sizing up a deal.
Can a cap rate be too high?
Absolutely. While a high cap rate looks fantastic on paper, a number that seems too good to be true—say, well into the double digits—should be a red flag. An unusually high cap rate often points to hidden risks, such as a property needing major repairs, being in a declining neighborhood, or having unstable rental income. Always investigate why the cap rate is so high before getting excited.
How do interest rates affect cap rates?
Think of interest rates and cap rates as being on opposite ends of a seesaw. When one goes up, the other tends to follow. As interest rates rise, borrowing money becomes more expensive. To make an investment worthwhile, buyers need a higher return, which pushes cap rates up. Conversely, when interest rates are low, buyers are willing to accept lower returns, which pushes cap rates down.
Should I trust the seller’s advertised cap rate?
Treat a seller's advertised cap rate with a healthy dose of skepticism. It’s a starting point, not the final word. Often, sellers use a "pro-forma" cap rate, which is a best-case-scenario calculation that might assume 100% occupancy or unrealistically low expenses. Always do your own homework and calculate the cap rate using real, verified numbers from the property's financial records.
Ready to stop guessing and start analyzing with confidence? Flip Smart gives you the tools to calculate accurate cap rates, cash-on-cash returns, and the full profit potential on any property in seconds. Make faster, smarter investment decisions by visiting https://flipsmrt.com today.