When you invest in a rental property, you're not just buying a house—you're purchasing an asset designed to generate income. But how do you actually measure its success? It all comes down to two key ways your property builds wealth for you.
The first is the most straightforward: rental income. This is the rent you collect from your tenants each month. After you subtract all your operating expenses—like the mortgage, property taxes, insurance, and repairs—the money left over is your cash flow. It's the immediate, tangible return you see in your bank account.
The second, slower-building component is property appreciation. Over time, real estate values tend to rise due to inflation, increasing demand, and neighborhood improvements. While this isn't cash you receive today, it's a huge part of your total profit that you'll realize when you eventually sell or refinance the property.
Think of it this way: cash flow helps pay your bills today, while appreciation builds your net worth for tomorrow.
This simple flow chart breaks it down visually, from collecting rent to building long-term value.
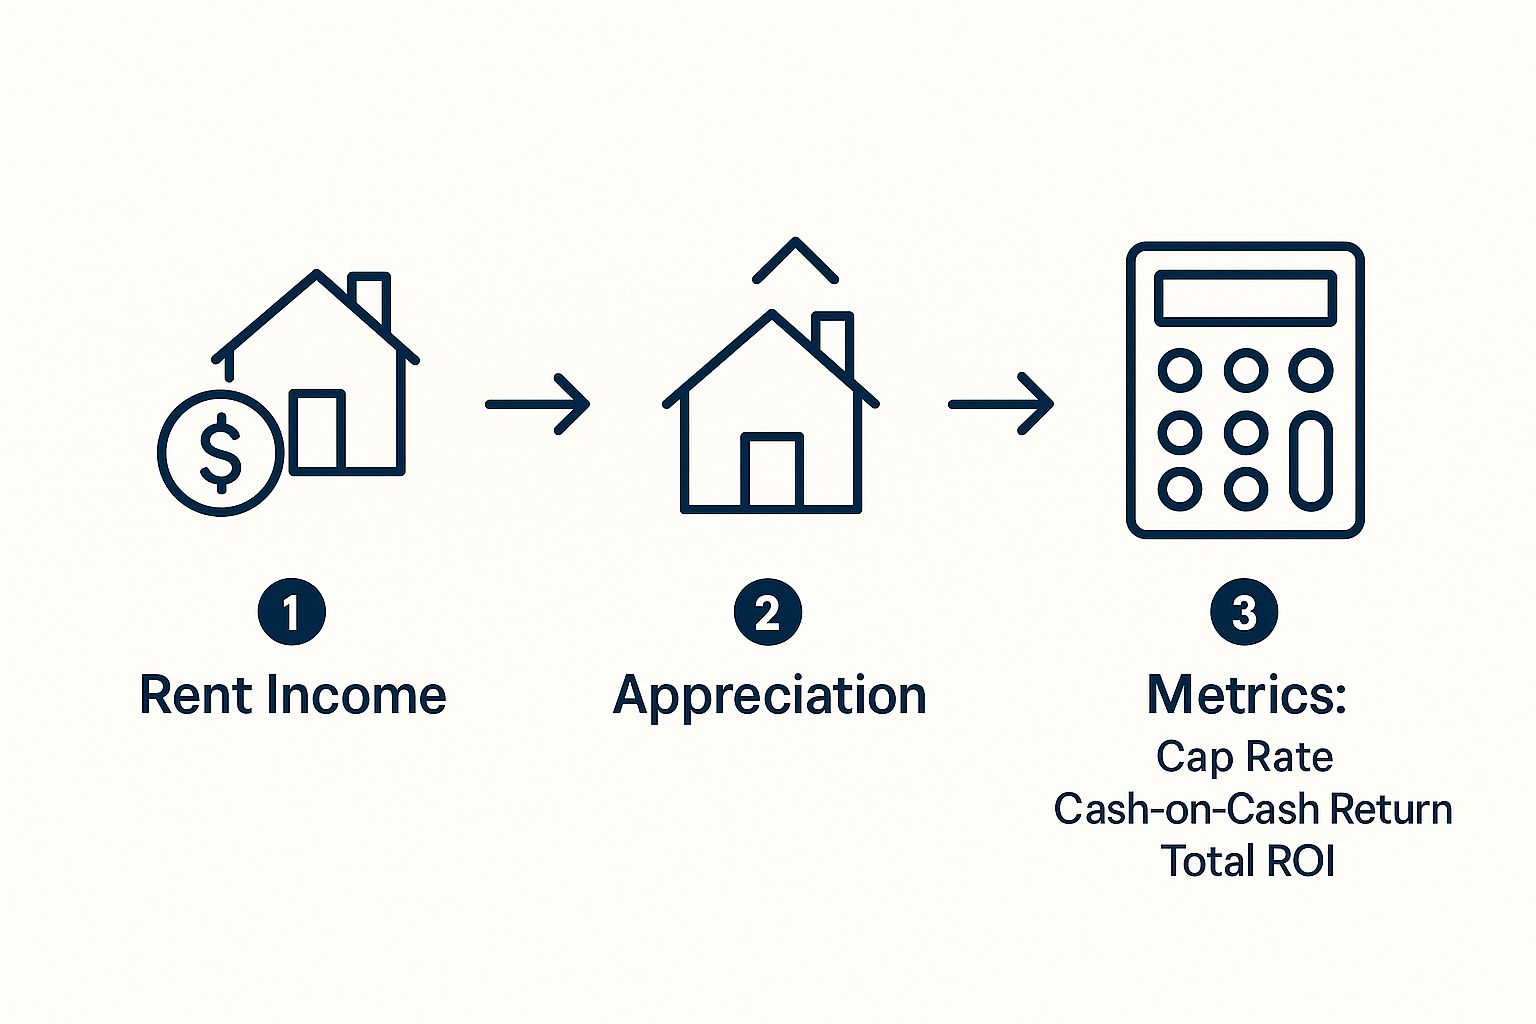
Successful real estate investing is all about getting both of these wealth-building engines running smoothly.
Why Rental Properties Are a Powerful Investment
History has shown that real estate is an incredibly resilient and profitable asset. In fact, one major study covering 145 years of data found that rental properties delivered an average return of 7.05%, which actually beat out stocks at 6.89%. This shows that the combination of rental income and appreciation can create serious wealth over the long haul.
But to truly understand how well your investment is doing, you need to know how to measure its performance. Investors rely on a few key calculations to get a clear picture of an investment's financial health. These aren't just confusing acronyms; they're simple tools that each tell a different part of your property's story.
To get started, you'll need to wrap your head around three core metrics. Each one offers a unique lens for looking at your property's performance, from its raw income potential to what it means for your wallet personally.
Three Core Metrics for Measuring Rental Returns
| Metric | What It Measures | Best For |
|---|---|---|
| Cap Rate | The property's unleveraged annual return, assuming an all-cash purchase. | Quickly comparing the raw profitability of different properties, regardless of financing. |
| Cash-on-Cash Return | The annual pre-tax cash flow relative to the actual cash you invested out-of-pocket. | Understanding your personal return on the money you actually put into the deal. |
| Total ROI | The overall return, including cash flow, equity buildup, and appreciation. | Seeing the big picture of your investment's total wealth-building power over time. |
Mastering these concepts is what separates a casual home buyer from a confident, strategic investor. Once you understand them, you'll be ready to analyze deals, spot opportunities, and build a truly profitable portfolio. In the next sections, we’ll break down exactly how to calculate and use each of these powerful metrics.
Calculating Profitability with Cap Rate
When you're sizing up investment properties, you need a quick, apples-to-apples way to gauge their raw income potential. Think of it like a car's MPG rating—it gives you a standard number to compare one against another, no matter the make or model. In real estate, our MPG is the Capitalization Rate, or Cap Rate.
The Cap Rate shows you the potential annual return on a property if you bought it with all cash. By stripping away the specifics of your mortgage, it lets you focus purely on the property's own ability to make money relative to its price. It's a fundamental tool for comparing multiple listings on a level playing field.
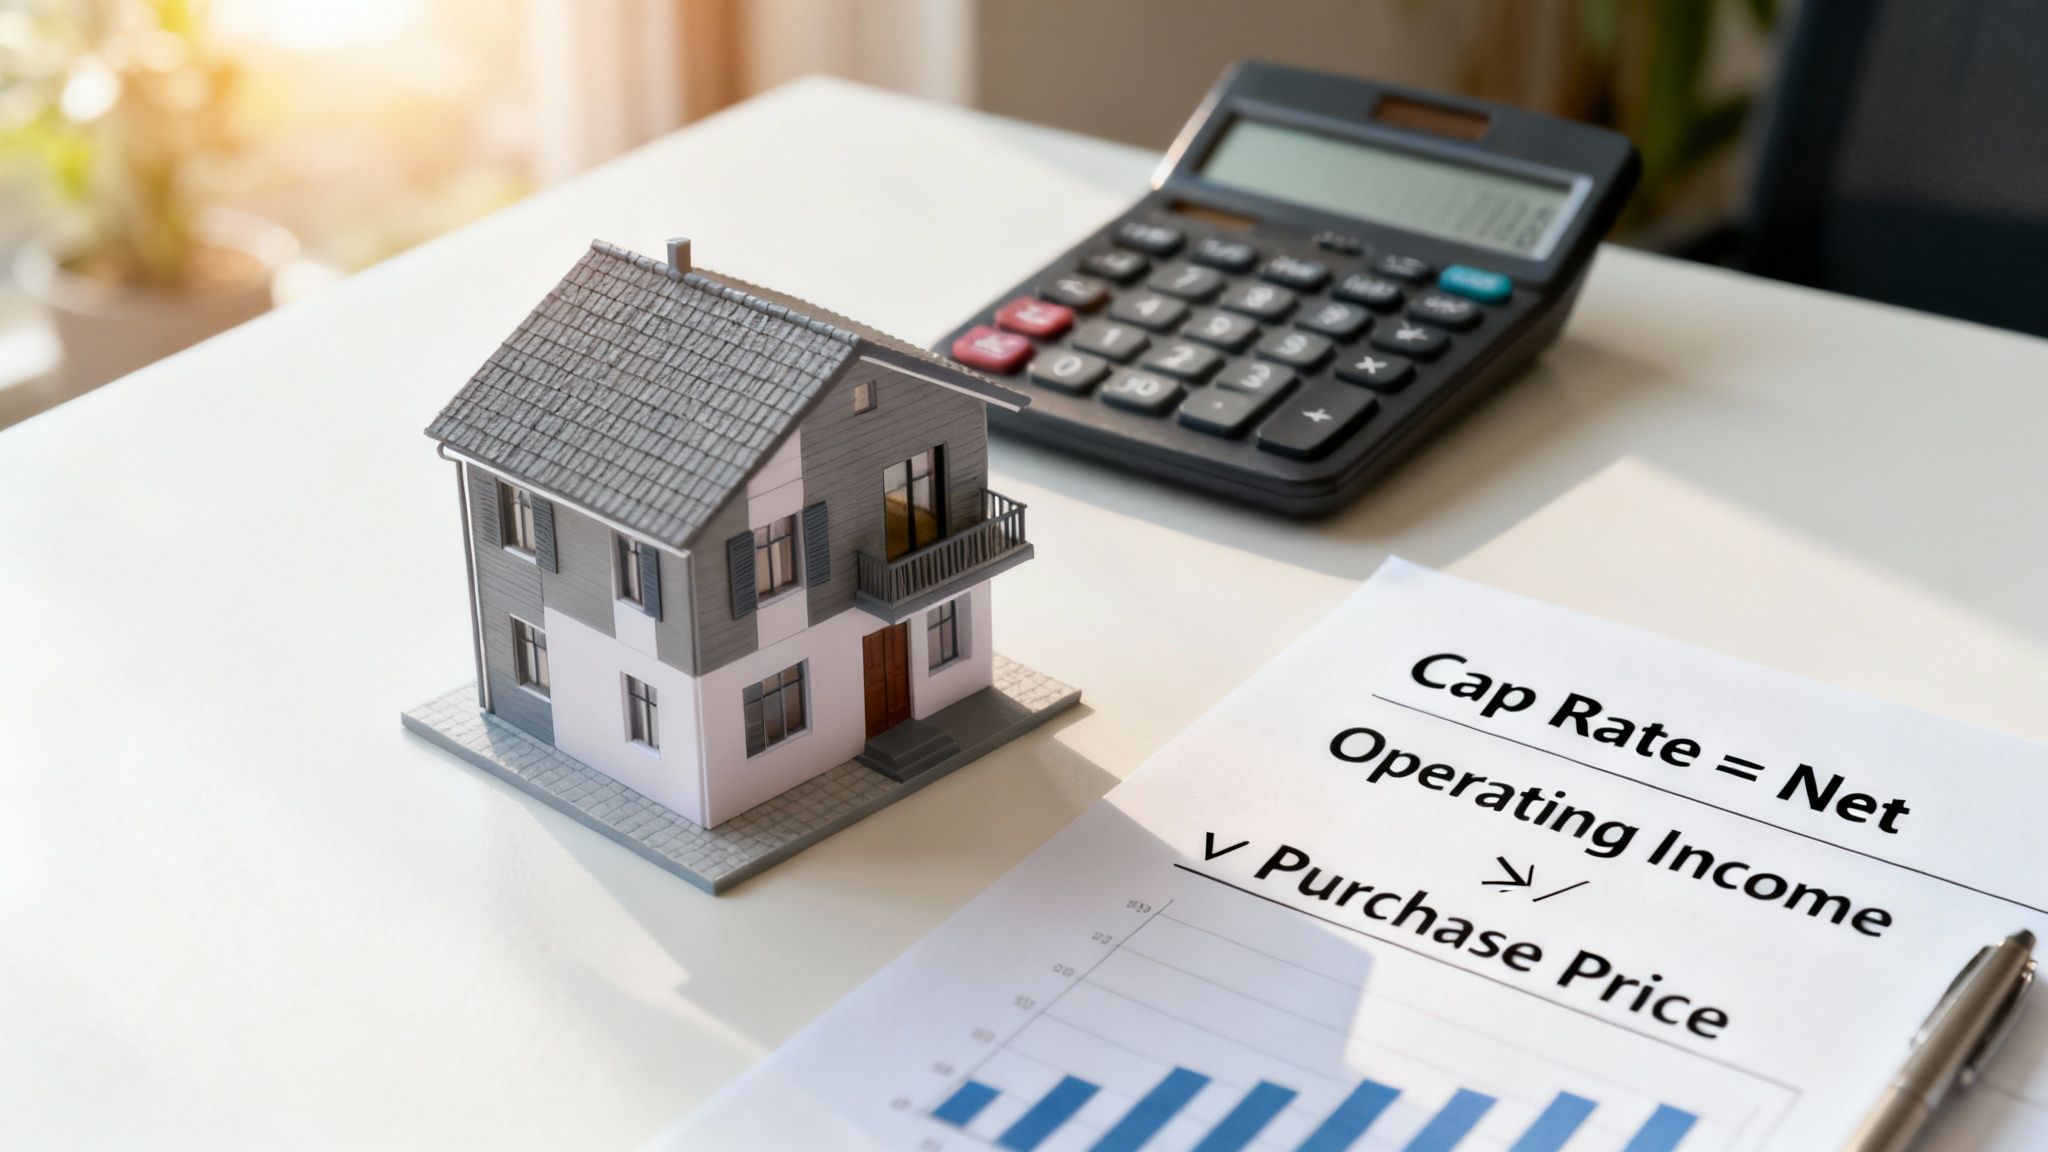
The Simple Cap Rate Formula
Calculating the Cap Rate is refreshingly straightforward. It all comes down to one simple formula that tells you a powerful story about a property's performance.
Cap Rate = Net Operating Income (NOI) / Property Purchase Price
Looks easy, right? The real work is in understanding its two key ingredients: the property's price and, more importantly, its Net Operating Income (NOI). Let's dig into how you find that number.
Finding Your Net Operating Income
Your Net Operating Income (NOI) is the pure profit a property generates before you factor in your mortgage payments or income taxes. It’s the cash left over after paying all the essential bills to keep the place running smoothly.
First, you need to figure out your Gross Operating Income, which is every penny the property could possibly bring in.
- Annual Rental Income: The total rent you expect to collect over a full year.
- Other Income: Don't forget any extra fees you collect for things like parking, laundry, or pets.
Next, you have to subtract all of your Operating Expenses. These are the unavoidable costs of owning and maintaining the property (but, critically, not your loan payments).
- Property Taxes: Your annual bill from the local government.
- Insurance: Your landlord or hazard insurance premium.
- Utilities: Any costs not passed on to tenants (like water for a common area laundry room).
- Maintenance and Repairs: Your budget for routine upkeep and those inevitable surprise fixes.
- Property Management Fees: Usually 8-12% of the monthly rent if you hire a pro.
- Vacancy: A crucial buffer for when the property is empty between tenants. A conservative 5-10% of gross rent is a smart place to start.
Subtract your total operating expenses from your gross income, and voilà—you've got your NOI. For anyone new to this, learning how to calculate cap rate for rental property is a skill that will pay dividends for your entire investing career.
Putting It All Together with an Example
Let's walk through an example. Imagine you're looking at a duplex on the market for $400,000.
Calculate Gross Operating Income:
- Each unit rents for $1,600/month, bringing in a total of $3,200/month.
- Annual Rental Income: $3,200 x 12 = $38,400
Calculate Total Operating Expenses:
- Property Taxes: $4,500/year
- Insurance: $1,200/year
- Vacancy (5% of rent): $1,920/year
- Maintenance (5% of rent): $1,920/year
- Total Expenses: $9,540
Calculate Net Operating Income (NOI):
- NOI = $38,400 (Gross Income) - $9,540 (Expenses) = $28,860
Calculate the Cap Rate:
- Cap Rate = $28,860 (NOI) / $400,000 (Price) = 0.072 or 7.2%
This 7.2% Cap Rate is your benchmark. Now you can confidently compare this duplex to any other property, no matter its price, and see which one offers a better return on a fundamental level. For a deeper dive into all the nuances, check out our guide on how to figure cap rate.
Using Cash-on-Cash Return for Your Personal ROI
While Cap Rate gives you a fantastic, high-level view for comparing properties, it misses one huge piece of the puzzle: your personal financing. That’s where Cash-on-Cash Return comes in.
Think of this metric as the "what's in it for me?" calculation. It tells you exactly what kind of return you're getting on the actual, hard-earned dollars you pull out of your bank account to make the deal happen.
This is arguably the most personal metric for an investor because it focuses solely on your out-of-pocket investment. It ignores the property's total price and zooms in on the cash you personally contribute, which includes your down payment, closing costs, and any initial repair expenses needed to get the property rent-ready.
Calculating Your Cash-on-Cash Return
The formula is incredibly intuitive because it directly answers the question, "How much cash did I get back this year compared to the cash I put in?"
Cash-on-Cash Return = Annual Pre-Tax Cash Flow / Total Cash Invested
To get this number, you first need to figure out your annual pre-tax cash flow. This is different from the Net Operating Income (NOI) we used for Cap Rate because it includes one major expense that NOI ignores: your mortgage payment. For a detailed walkthrough, you can learn how to calculate cash flow on rental property to master this crucial step.
An Example of How Financing Changes Everything
Let's go back to that $400,000 duplex with an NOI of $28,860 and a 7.2% Cap Rate. Now, let's say you don't buy it with cash. Instead, you secure a loan.
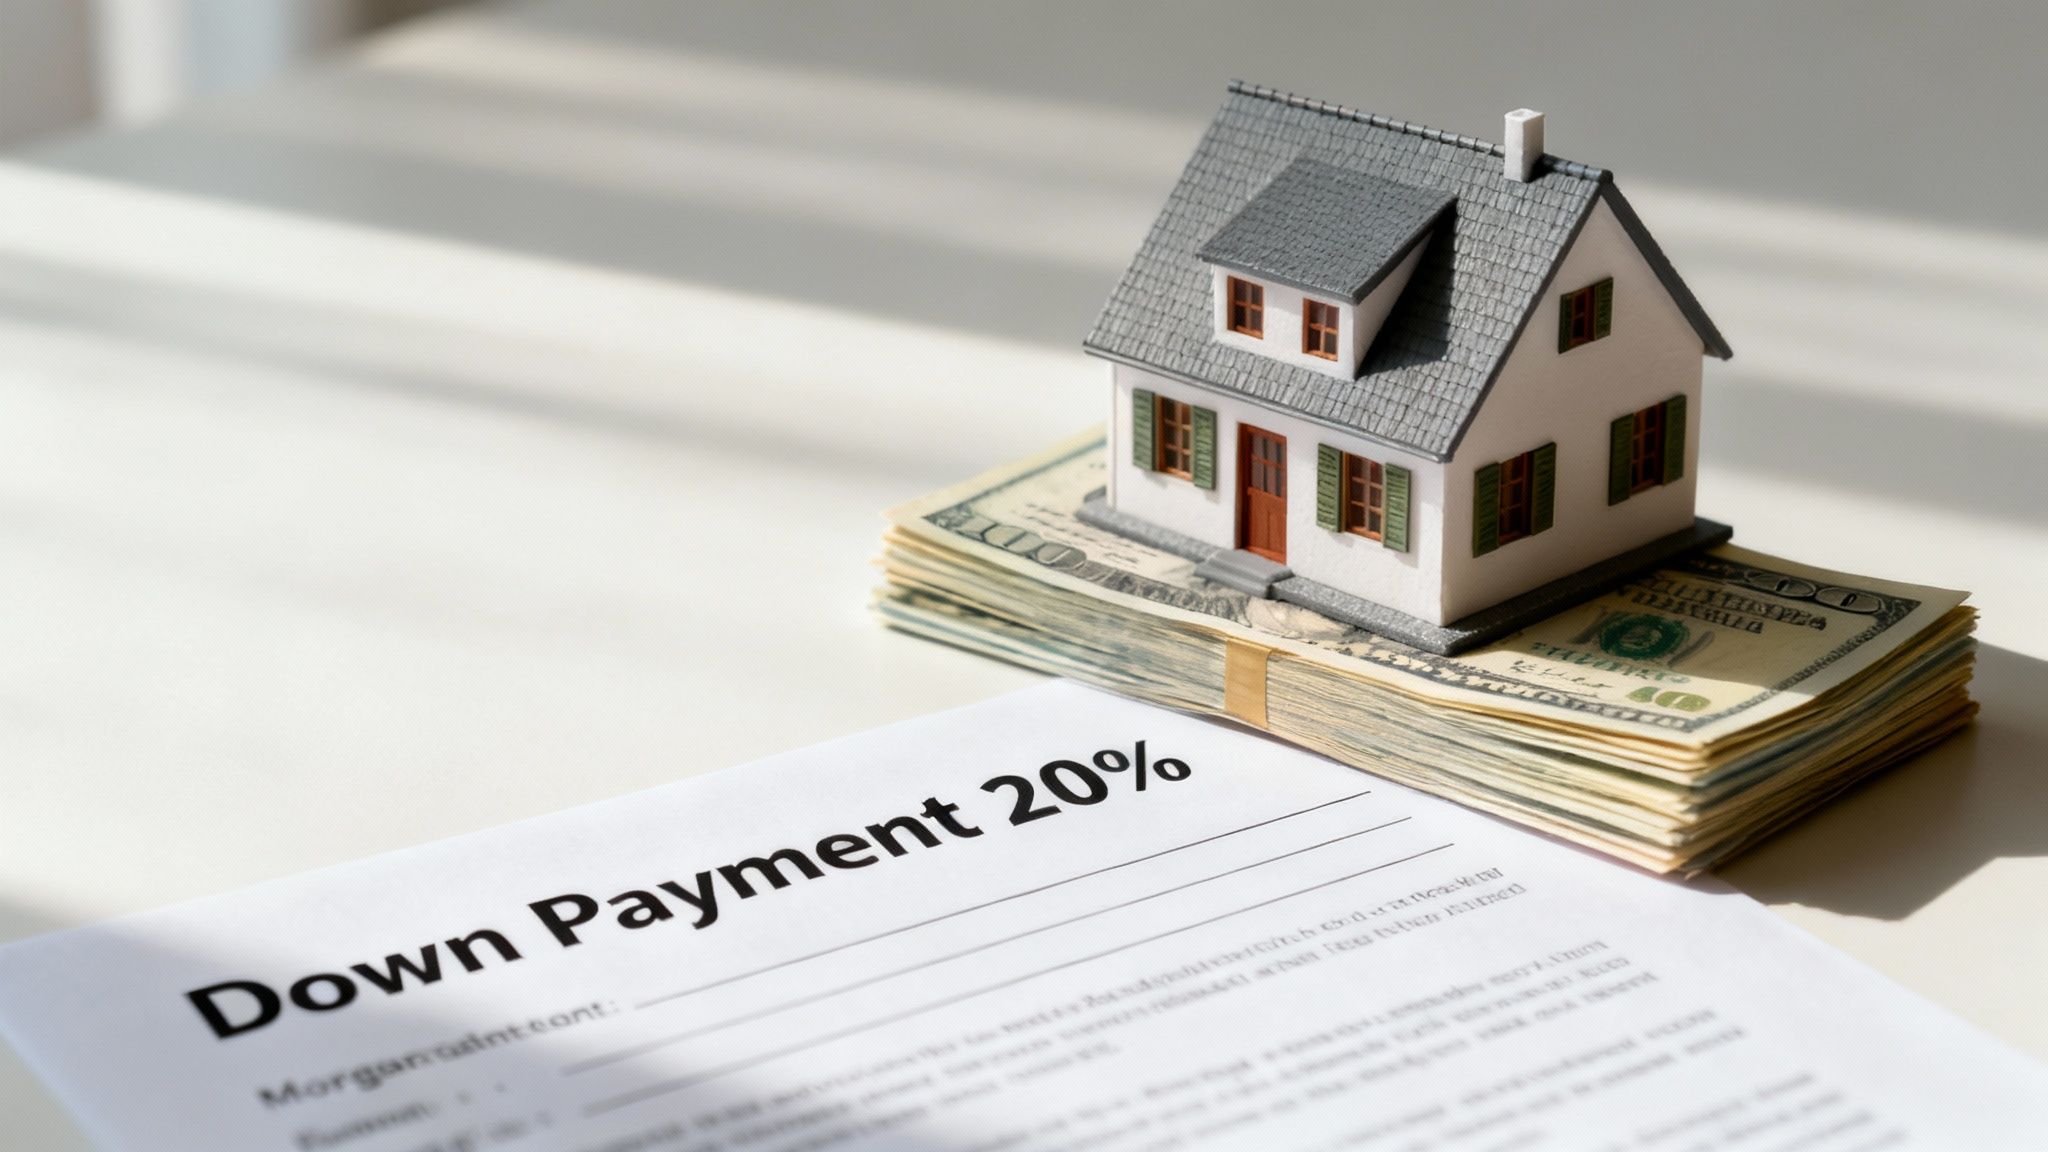
1. Calculate Your Total Cash Invested:
- Down Payment: You put 20% down, which is $80,000.
- Closing Costs: These typically run 3% of the purchase price, adding another $12,000.
- Total Cash Invested: $80,000 + $12,000 = $92,000
2. Calculate Your Annual Mortgage Payment:
- You financed the remaining $320,000 at a 6.5% interest rate over 30 years.
- Your monthly principal and interest payment is approximately $2,023.
- Your annual mortgage cost is $2,023 x 12 = $24,276.
3. Determine Your Annual Pre-Tax Cash Flow:
- Start with your NOI: $28,860
- Subtract your annual mortgage payments: $28,860 - $24,276 = $4,584
4. Find Your Cash-on-Cash Return:
- Cash-on-Cash Return = $4,584 / $92,000 = 0.0498 or just under 5%.
Why This Metric Is So Powerful
That 5% figure tells a completely different story than the 7.2% Cap Rate, doesn't it? It reflects your real-world financial situation. Using a mortgage, a concept known as leverage, can dramatically change your returns on a rental property.
This is exactly why a property with a lower Cap Rate isn't automatically a worse deal. If you can secure favorable financing, you might achieve a higher Cash-on-Cash Return on a 6% Cap Rate property than you would on an 8% Cap Rate property with less attractive loan terms.
It all comes down to the numbers that affect your personal bank account.
Understanding Your Long-Term Gains with Total ROI
Cap Rate and Cash-on-Cash Return are great for understanding a property's income potential, but they only tell part of the story. A rental’s true power comes from its long-term growth.
To see the full picture, we need a wider lens: Total Return on Investment (Total ROI).
This is the all-in metric that combines the cash you get today with the silent, powerful wealth being built in the background. Think of it like a tree: cash flow is the fruit you harvest each year, but Total ROI measures the growth of the entire tree.
The Three Pillars of Total ROI
Total ROI is built on three distinct components. Grasping how they work together is the key to seeing your rental not just as a monthly check, but as a long-term wealth-building machine.
The formula adds two new elements to what we've already covered:
Total Annual Return = Annual Cash Flow + Annual Principal Paydown + Annual Appreciation
Let's break down the two new players in this powerful equation.
Building Wealth Through Principal Paydown
Every time you make a mortgage payment, a chunk of it pays down the principal—the original amount you borrowed. This principal paydown is a form of forced savings that quietly builds your equity month after month.
It's money you don't actually see in your bank account, but it directly increases your net worth. With each payment, you own a slightly larger piece of the property. This process really picks up steam in the later years of a loan.
Capturing Growth with Appreciation
The second powerful force is appreciation: the increase in your property's market value over time. This growth is driven by things like inflation, neighborhood improvements, and simple supply and demand in your area.
While nothing is guaranteed, real estate has historically trended upward. This increase in value is a massive component of your total profit and often becomes the single largest part of your return when you eventually sell or refinance.
Putting It All Together in a Real-World Scenario
Let's jump back to our $400,000 duplex. You put $92,000 down and you're making $4,584 in annual cash flow. Now, let's factor in the long-term components after one year.
1. Calculate Annual Principal Paydown:
- You made $24,276 in total mortgage payments for the year. In the first year of a loan, we'll estimate that about $3,500 of that went toward reducing the loan principal. (This amount gets bigger every year).
2. Estimate Annual Appreciation:
- Let's use a conservative 3% annual appreciation rate on the $400,000 property value.
- Annual Appreciation = $400,000 x 0.03 = $12,000.
3. Calculate Your Total Annual Gain:
- Total Gain = $4,584 (Cash Flow) + $3,500 (Principal Paydown) + $12,000 (Appreciation) = $20,084.
4. Determine Your Total ROI:
- Total ROI = $20,084 (Total Gain) / $92,000 (Total Cash Invested) = 21.8%.
This 21.8% Total ROI reveals the true performance of your investment, completely dwarfing the 5% Cash-on-Cash return. It shows how your initial investment is working on multiple fronts to build sustainable, long-term wealth.
To experiment with your own numbers, using a quality real estate investment calculator can provide instant clarity on all these metrics.
What Is a Good Return on a Rental Property?
Okay, you've got the formulas down. Now for the million-dollar question: what numbers should you actually be aiming for?
The honest answer? There's no single magic number. A "good" return is completely dependent on your goals, the market you're investing in, and how much risk you're comfortable taking on.
There's no universal scoreboard for success here, but there are definitely some widely accepted benchmarks that can help you set realistic expectations. Think of these as guideposts, not rigid rules. They're what seasoned investors use to quickly tell if a deal is a dud, a decent opportunity, or a potential home run.
Setting Benchmarks for Your Returns
When experienced investors are sizing up a deal, two metrics usually jump to the front of the line: Cap Rate and Cash-on-Cash Return. Each one tells a different, crucial part of the financial story, and knowing the typical ranges for both is key.
A good Cap Rate generally lands somewhere between 4% and 10%. On the lower end, a 4-6% cap rate is common in stable, high-demand urban areas where you're banking on appreciation to do the heavy lifting. A higher cap rate, say 8-10% or more, is typical in less expensive markets where strong monthly cash flow is the main prize.
For Cash-on-Cash Return, most investors are hunting for something in the 8% to 12% range. Because this metric is all about the cash you personally put into the deal, it really shows you the power of leverage. Hitting a double-digit return here means your out-of-pocket investment is working hard for you.
A classic rookie mistake is just chasing the highest percentage without understanding the story behind it. A 5% return in a booming city could be a brilliant long-term play, while a 12% return in a declining town might be a disaster waiting to happen.
Why a Good Return Is Never One-Size-Fits-All
The idea of a "good" return is intensely personal. An investor nearing retirement might be thrilled with a steady, low-risk 7% return from a Class A property. They're prioritizing stable cash flow and wealth preservation over aggressive growth.
On the flip side, a younger investor might target a property with a much lower 4% Cash-on-Cash return if they believe its value could double over the next decade. Their strategy is built around appreciation, and they have the time horizon to wait for it. Your strategy is what defines your success.
Just look at the broader real estate market—returns vary wildly. Historically, the U.S. housing market has offered around a 5.5% rate of return, while commercial properties have averaged closer to 9.5%. Understanding these wider trends, especially as the global real estate rental market is projected to grow, is crucial. You can see more data comparing different types of real estate returns on SparkRental.com.
A Guide to Rental Property Return Benchmarks
To give you a clearer picture of what to look for, we've put together a table of common benchmarks. This is a general guide to help you quickly assess a potential deal, but remember, these are just starting points. The right numbers for you will always circle back to your specific market and personal strategy.
Typical Return Benchmarks for Rental Properties
Here's a general guide to benchmark returns investors often look for. Keep in mind that these can vary significantly by location, property type, and your overall investment strategy.
| Metric | Conservative Target | Good Target | Excellent Target |
|---|---|---|---|
| Cap Rate | 4% - 6% | 6% - 8% | 8% or higher |
| Cash-on-Cash Return | 6% - 8% | 8% - 12% | 12% or higher |
| Total ROI | 10% - 15% | 15% - 20% | 20% or higher |
Ultimately, the best returns are the ones that actually help you hit your financial goals. By understanding these benchmarks and being crystal clear on your own objectives, you can analyze deals with confidence, knowing exactly what a "win" looks like for you.
Key Factors That Influence Your Investment Returns
Calculating returns is a critical first step, but the numbers in a spreadsheet only tell half the story. The real-world performance of your investment property hinges on a handful of key factors that can either supercharge your profits or slowly eat away at your cash flow.
Getting a handle on these variables is what separates the amateur investor from the seasoned pro. Think of your rental as a living, breathing asset. Its financial health is directly tied to its environment and the care you put into it. Just like a gardener manages soil, sunlight, and water, a smart investor obsessively tracks location, property condition, financing, and management.
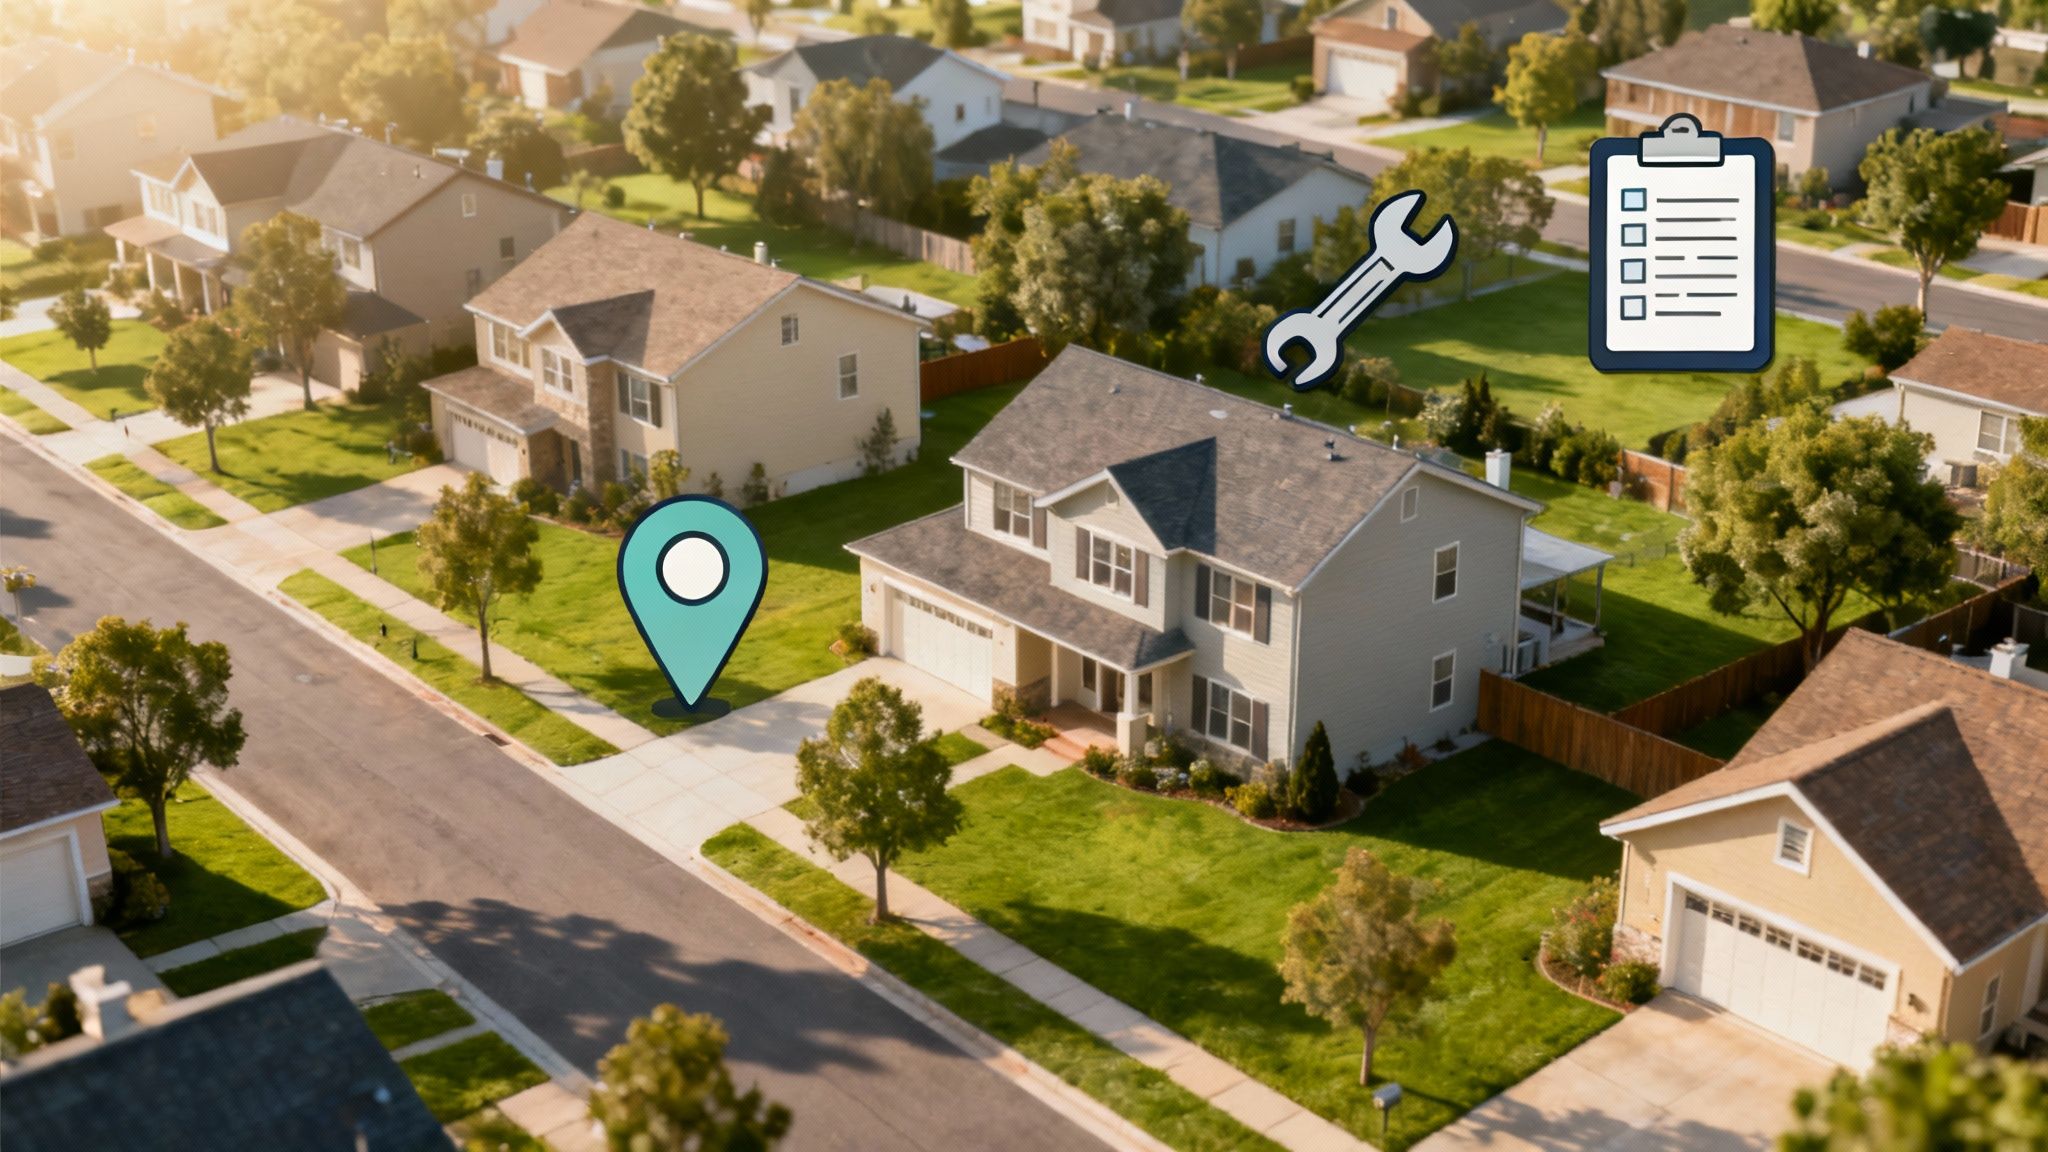
Location: The Undeniable Driver of Value
You’ve heard it a million times: "location, location, location." In real estate, this isn't just a cliché—it's the golden rule. The right location is the engine for both rental demand and long-term appreciation, the two primary ways you make money.
A neighborhood with strong job growth, great schools, and plenty of amenities will consistently attract high-quality tenants. This means you can command higher rent, suffer fewer vacancies, and enjoy a much more stable income. A desirable location also acts as a powerful catalyst for appreciation, steadily growing your net worth while you sleep.
Property Condition and Maintenance
The physical shape of your property is a direct reflection of its financial health. A well-maintained home doesn't just attract better rent; it attracts responsible tenants who are far more likely to stick around. That drastically cuts down on turnover costs, one of the biggest silent killers of profit.
On the flip side, letting maintenance slide is a recipe for disaster. Small, ignored issues have a nasty habit of snowballing into expensive emergencies that can wipe out months of cash flow in one fell swoop.
Proactive maintenance isn’t an expense; it's an investment in your property's future profitability. A smart rule of thumb is to budget 5-10% of your rental income for ongoing repairs and future big-ticket items.
Your Financing and Loan Structure
How you buy the property has a massive impact on your bottom line, especially your Cash-on-Cash Return. The specific terms of your loan—your interest rate, the loan's duration, and how much you put down—directly shape your monthly mortgage payment.
Snagging a lower interest rate or stretching out the loan term can shrink your monthly payment, giving your cash flow an immediate boost. Conversely, putting more money down reduces your overall risk and monthly payment, but it also means you have more of your own cash tied up in one deal. This can actually lower your Cash-on-Cash Return percentage, even if the property is making more money overall.
Property Management Strategy
Finally, your day-to-day management approach plays a huge role. You really have two choices here: do it yourself or hire a professional.
Self-Management: Going the DIY route lets you pocket the 8-12% management fee, which flows straight to your bottom line. But don't underestimate the trade-off—it demands a serious commitment of your time, energy, and expertise in everything from tenant screening to emergency maintenance calls.
Hiring a Professional: A good property manager takes all the operational headaches off your plate. Their expertise often leads to better tenants, fewer vacancies, and more efficient maintenance, which can easily offset their fee. They are pros at optimizing profitability, and you can explore effective strategies for boosting your rental property's ROI to see how they do it.
Frequently Asked Questions About Rental Returns
Which metric is most important for a new investor to track?
For new investors, Cash-on-Cash Return is often the most important starting point. It directly answers the question, "How much am I earning on the actual money I invested?" It’s a real-world measure of your personal profitability. However, for comparing different properties quickly, Cap Rate is best. To see the full long-term potential, you'll need to calculate Total ROI. A smart investor uses all three.
How do I know if a property has good cash flow?
While there's no universal number, a common guideline for an initial check is the 1% Rule, which suggests the monthly rent should be at least 1% of the property's purchase price (e.g., a $200,000 house should rent for at least $2,000/month). This is just a quick screening tool, not a hard rule. A "good" cash flow ultimately depends on your market and investment goals; a property in a high-appreciation area may have lower cash flow but still be an excellent investment.
Are taxes included in these return calculations?
No, the common return metrics (Cap Rate, Cash-on-Cash Return, Total ROI) are calculated on a pre-tax basis. This is done to create a standard way to compare properties, as everyone's personal tax situation is different. Remember that real estate investing offers significant tax advantages, like deductions for mortgage interest, property taxes, and depreciation, which can substantially increase your true after-tax return. Always consult a tax professional for advice specific to your situation.
Can you still make money on a rental property with negative cash flow?
Yes, but it's an advanced and riskier strategy. This typically occurs in high-cost markets where an investor bets on rapid appreciation. They are willing to lose a small amount of money each month (negative cash flow) in the hope that the property's value will increase significantly, leading to a large profit when they sell. This approach requires deep cash reserves and is not recommended for most new investors.
Ready to stop guessing and start analyzing properties like a pro? Flip Smart gives you the tools to calculate valuations, estimate renovation costs, and project your returns on rental property in seconds. Make your next investment decision with confidence. Learn more and get started today at flipsmrt.com.