A rental property cap rate calculator is your first gut check on a potential investment. To put it simply, the capitalization rate (cap rate) is a percentage that shows how profitable a property is before you factor in a mortgage. It’s one of the most fundamental metrics every investor uses to stack up different deals on a level playing field. Think of it as a quick, simple way to compare the earning potential of different properties.
What Cap Rate Tells You About a Rental Property
Think of cap rate as a quick health screening for a real estate deal. It cuts through the noise of different financing terms and focuses purely on the property's power to generate income relative to its price. This single percentage helps you answer one critical question: "How hard is this asset actually working for me?"
By using a rental property cap rate calculator, you can quickly see if a property's asking price makes sense given its income potential. It's a fantastic tool for that initial screening, letting you weed out the duds and focus your energy on the deals that have real promise.
The Story Behind the Percentage
A cap rate isn’t just a number; it tells a story about risk and potential reward. Getting a feel for this relationship is absolutely key to making smart investment decisions.
- Higher Cap Rate (e.g., 8-12%): This usually signals a shot at higher returns, but it often comes with more risk. These properties might be in up-and-coming (or rougher) neighborhoods, demand more hands-on management, or need some serious work.
- Lower Cap Rate (e.g., 3-5%): A lower number typically means lower risk and more stability. You'll often see these in prime, high-demand areas where tenants are easy to find. The trade-off? The returns are smaller compared to the high price tag.
For example, a duplex in a developing part of town might show a 9% cap rate, tempting you with strong cash flow but also bringing more uncertainty. On the flip side, a condo in a hot downtown area might have a 4% cap rate, offering a safer, more predictable income stream.
Quick Takeaway: A cap rate strips away the complexities of loans and debt, allowing you to compare the raw operational performance of a property in Austin with one in Cleveland. It equalizes the playing field.
Why It's Your First Step in Analysis
Before you start building out a massive spreadsheet, the cap rate gives you an immediate benchmark. The insights from a cap rate calculator are invaluable, especially when you're considering buying a ready-to-let rental property, because it helps you quickly assess its potential. It’s about grounding your analysis in cold, hard numbers instead of getting swept up by emotion.
This metric is a lifesaver when you're sorting through a dozen listings. Instead of getting bogged down in the specific details of each property right away, you can run a quick cap rate comparison to see which ones are even worth a deeper dive. It's your first line of defense against a bad investment.
Calculating Net Operating Income: Your Most Important Input
Any rental property cap rate calculator is only as good as the numbers you feed it. The purchase price is easy—it’s a fixed number. But the other half of the equation, the Net Operating Income (NOI), is where experienced investors really set themselves apart. If you get this wrong, your entire analysis is built on a house of cards.
So, what is NOI? It's simply the property's total income minus all its operating expenses. Think of it as the pure, unadulterated profit the building itself generates each year, before you factor in your mortgage or income taxes. It’s the truest measure of an asset's standalone performance.
Start with the Total Potential Income
First things first, you need to figure out every dollar the property could possibly bring in over a year. And no, it’s not just the monthly rent.
You begin with the Gross Scheduled Rent—that's the total rent you'd collect if the property was occupied 100% of the time. For a single-family home renting at $2,500 a month, your gross scheduled rent is $30,000 per year.
But let's be realistic. No property stays full all the time. You have to account for vacancy. A conservative vacancy rate is typically between 5% and 10%, depending on your local market. If we use 5%, that’s an immediate $1,500 deduction from our $30,000 gross rent.
Don't stop there. What about other income sources? Things like coin-operated laundry, parking fees, or even late payment fees add up. Let's say the laundry brings in an extra $500 a year. Now we have a much more realistic picture of our total income. For a complete breakdown of this process, check out our guide on how to accurately calculate rental income.
Now, Subtract Your Operating Expenses
This is where your diligence truly pays off. Operating expenses are the non-negotiable, day-to-day costs of keeping the lights on and the property in good shape. They are the cost of doing business as a landlord.
Here are the expenses you absolutely cannot forget:
- Property Taxes: A significant, unavoidable cost. You can usually find this on the county tax assessor's website or the property listing itself.
- Property Insurance: You need a solid landlord policy to protect your investment. Get a few quotes to lock in an accurate annual premium.
- Repairs and Maintenance: Stuff breaks. It's a fact of life. A good starting point is budgeting 1% of the property's purchase price each year. On a $400,000 home, that's $4,000 set aside annually.
- Property Management Fees: Even if you plan to manage it yourself, always bake this in (typically 8-10% of gross rent). This ensures the deal still works if you hire help later, and it also "pays" you for your time.
- Utilities: Are you on the hook for water, sewer, or trash? If so, it's an operating expense.
- HOA Fees: If it's in a homeowners association, these recurring fees go straight into your expense column.
Important Note: One of the biggest mistakes new investors make is forgetting to budget for Capital Expenditures (CapEx). These are the big-ticket items—a new roof, an HVAC system, a water heater. A smart move is to set aside another 5-10% of your gross rent just for these future bombshells.
A Critical Mistake to Avoid
It’s just as important to know what not to include. The single biggest error I see investors make is subtracting their mortgage payment (principal and interest) when calculating NOI.
Don't do it. Remember, cap rate is designed to measure the property's performance, completely independent of your financing. Tossing your mortgage payment into the mix makes it impossible to fairly compare one property against another. NOI is a pre-debt figure, and that's precisely what makes it such a powerful tool for apples-to-apples comparisons.
Putting It All Together: A Sample Calculation
Let's pull all these numbers together for a real-world example: a single-family rental purchased for $400,000. We'll use the figures we've discussed to nail down its true NOI.
Here is a simple breakdown of how that looks:
Sample NOI Calculation for a Single-Family Rental
| Item | Monthly Amount | Annual Amount |
|---|---|---|
| Gross Scheduled Rent | $2,500 | $30,000 |
| Vacancy Loss (5%) | -$125 | -$1,500 |
| Other Income (Laundry) | $42 | +$500 |
| Effective Gross Income (EGI) | $29,000 | |
| Property Taxes | -$375 | -$4,500 |
| Insurance | -$100 | -$1,200 |
| Repairs & Maintenance | -$167 | -$2,000 |
| Property Management (8% of EGI) | -$195 | -$2,320 |
| Capital Expenditures (CapEx) | -$125 | -$1,500 |
| Total Operating Expenses | -$11,520 | |
| Net Operating Income (NOI) | $1,457 | $17,480 |
With a carefully calculated NOI of $17,480, you now have a reliable, defensible number. This isn't a guess; it's a reflection of the asset's true earning power. Now you're ready to plug it into any rental property cap rate calculator and get a result you can actually trust.
A Practical Walkthrough of a Cap Rate Calculator
Okay, you've crunched the numbers and have a solid Net Operating Income (NOI). Now it's time to put that number to work with a rental property cap rate calculator. This is where the theory gets real, fast. These online tools are usually pretty straightforward, but remember: the quality of the answer you get out is 100% dependent on the quality of the numbers you put in.
Let's walk through how to use one, field by field, so you know exactly what you're looking at and can trust the result.
Most calculators you'll find online are designed for speed. They just need a few key details to spit out a cap rate, which is perfect for quickly comparing a handful of properties you're looking at. The layout usually underscores just how critical it is to have your income and expense numbers nailed down before you even start plugging them in.
Sourcing Your Data Like a Pro
The old saying "garbage in, garbage out" has never been more true. The single biggest mistake investors make is guessing or, even worse, just trusting the seller's proforma numbers without digging deeper. Here’s where to find real, reliable data for each input.
- Purchase Price: This one's easy. It’s the asking price or whatever you plan to offer.
- Gross Rental Income: Don't just accept the current rent as gospel. Jump on sites like Zillow or Rentometer to see if the property is renting for market rate. Is it too high? Too low? This instantly tells you if there's an opportunity to add value by raising rents.
- Property Taxes: This is public record, so no excuses for guessing. Head to the local county tax assessor's website. A quick property search will show you the exact tax bill from the previous year.
- Insurance: Never, ever use a ballpark figure. Call a local insurance agent and get an actual quote for a landlord policy on that specific property. It's a five-minute phone call that can save you from a major miscalculation.
Estimating the "Invisible" Costs
Some of the most important expenses are the ones that never show up on a listing sheet. You have to project these yourself, and being a little conservative here is what separates savvy investors from those who get blindsided.
Vacancy Rate
No property stays occupied 100% of the time. A solid rule of thumb is to budget for a 5% to 10% vacancy rate. If you're in a red-hot market where units are filled in a day, 5% might be safe. But if it’s a college town where everyone leaves for the summer, budgeting 10% (or even more) is far more realistic.
Maintenance and Repairs
The 1% Rule is a classic for good reason. Plan to set aside at least 1% of the property's purchase price every year for routine maintenance. On a $300,000 property, that's $3,000 a year, or $250 per month, for the inevitable leaky faucets, appliance repairs, and general upkeep.
Capital Expenditures (CapEx)
This isn't the same as maintenance. CapEx is for the big-ticket items that wear out over time—think a new roof ($10,000+), an HVAC system ($7,000+), or a water heater ($1,500+). A common practice is to sock away another 5% of your gross rent specifically for these future bombshells.
This diagram shows the simple but powerful flow of how your NOI comes together.
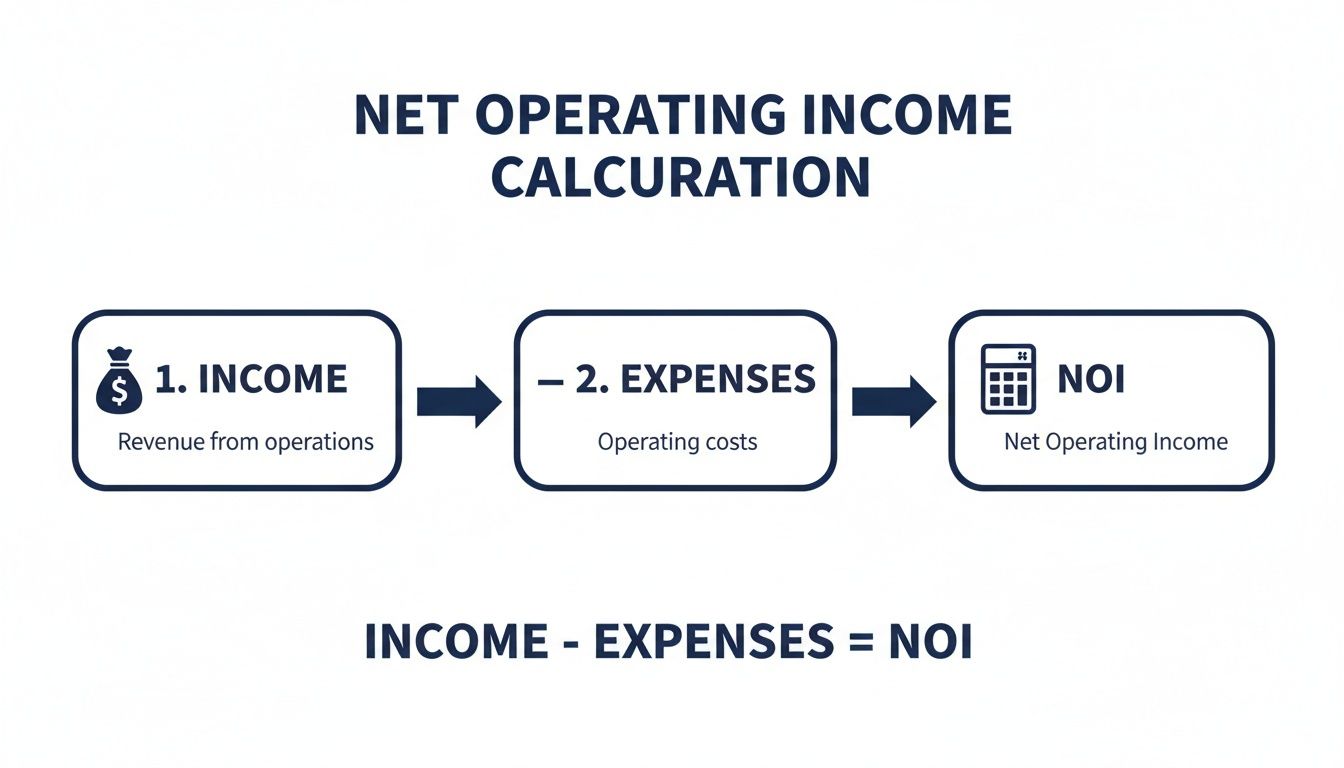
As you can see, your final NOI is the pure profit the property generates after all operating costs are paid but before the mortgage. That’s why it's the most critical number for your cap rate calculation.
Interpreting the Final Percentage
After you've entered all your carefully researched numbers, the calculator will give you a percentage. Let's say it's 6.2%. What does that actually mean in plain English?
A 6.2% cap rate means that for every $100 you invested in the property's purchase price, you can expect an annual return of $6.20before factoring in your loan payments. It’s a pure, apples-to-apples measure of the property's earning power.
This single number becomes your ultimate comparison tool. If Property A has a 6.2% cap rate and Property B in a similar area has a 4.9% cap rate, you know that Property A is generating more income relative to its price.
Now, that doesn't automatically make it the "better" deal—maybe Property B is in a rapidly appreciating neighborhood. But it gives you an objective, data-driven starting point to quickly filter a list of potential investments and decide which ones are actually worth a deeper look.
How to Judge a Good Cap Rate in Different Markets
One of the first questions every new investor asks is, "What's a good cap rate?" The honest, and most accurate, answer is always the same: it depends.
A 7% cap rate might be an absolute home run in a booming city like Austin, but it could be a risky strikeout in a town with a shrinking job market. A rental property cap rate calculator gives you the number, but it’s the context behind that number that separates the pros from the amateurs.
Think of cap rate as a direct reflection of risk and potential. A low cap rate isn't automatically "bad," and a high one isn't a guaranteed winner. It’s all about the balancing act between the return you need and the risk you’re willing to stomach.
The Influence of Local Market Dynamics
The single biggest factor that defines a "good" cap rate is the local market. Different cities—and even different neighborhoods in the same city—operate with completely different expectations.
Here’s a simple way to break it down:
High-Growth Markets: Cities with explosive job growth, a growing population, and high demand (think Nashville or Raleigh) tend to have lower cap rates. Investors are willing to pay more for properties here, betting on future appreciation to deliver their returns. A 4-5% cap rate in a prime location could be a fantastic deal because the potential for long-term value growth is immense.
Stable or Slow-Growth Markets: In more established, steady markets, like many you'd find in the Midwest, you'll see higher cap rates. A 7-10% cap rate might be the norm. Here, the investment thesis is less about explosive appreciation and more about generating strong, predictable cash flow from day one.
Property Class: The building's age and condition play a huge role. A brand-new Class A apartment building in an A+ school district will trade at a much lower cap rate than an older, C-class building that needs a ton of work. The lower cap rate reflects lower perceived risk and less hands-on management.
Quick Takeaway: A low cap rate often means you're paying for stability and future potential, while a high cap rate means you're being compensated for taking on more immediate risk.
Adjusting Your Expectations for Property Type
Not all real estate is created equal, and the type of property you're analyzing will shift the goalposts for what a good cap rate looks like. You can't judge a duplex by the same standards as a commercial office building.
For instance, multifamily properties are often seen as less risky than single-family rentals. Why? Because a vacancy in one unit doesn't wipe out 100% of your income. Thanks to this built-in stability, investors are often willing to accept slightly lower cap rates on multifamily deals compared to single-family homes in the very same neighborhood. This is a crucial detail to remember when using a rental property cap rate calculator to compare different types of assets.
Understanding Broader Economic Trends
The bigger economic picture also plays a massive role in shaping cap rates. Look at what happened over the past couple of decades: a long period of falling interest rates pushed cap rates down across the board.
From the early 2000s to around 2020, commercial real estate cap rates compressed from a range of 8–10% down to about 5–7%. This compression of 300–400 basis points (or 3-4%) dramatically pushed property values up, showing just how tightly cap rates are tied to the wider financial world. To dig deeper, you can learn more about how real estate cycles influence cap rates.
When interest rates rise, investors need higher returns to justify the higher cost of borrowing, which puts upward pressure on cap rates. A seasoned investor doesn't just look at today's cap rate; they’re always thinking about where the economy is headed and how that might impact their investment’s value down the road.
Beyond Cap Rate: The Metrics That Tell the Full Story

A rental property cap rate calculator is your first stop for a quick, unbiased comparison of potential deals. It's fantastic for that initial gut check. But relying on cap rate alone is like judging a car by its paint job—it doesn't tell you what's under the hood.
To get the real story of a property's financial performance, you need to expand your toolkit. Think of it this way: the cap rate is the property's resume, showing its raw income-generating power. Other metrics are the interview, revealing how that property will actually perform for you and your specific financing. This deeper dive is what separates a good deal on paper from a truly great investment.
Cash-on-Cash Return: What Your Down Payment is Really Doing
While the cap rate completely ignores your mortgage, Cash-on-Cash Return puts it front and center. This metric gets straight to the point, showing the annual pre-tax cash flow you get back relative to the actual cash you pulled out of your pocket.
It answers the question every investor really wants to know: "For every dollar I put into this deal, how many cents am I getting back each year?"
The formula is dead simple: Annual Pre-Tax Cash Flow ÷ Total Cash Invested.
Let's run a quick scenario. You're buying a property for $400,000. You put down 25% ($100,000) and your closing costs are another $5,000. Your total cash out-of-pocket is $105,000. After paying all operating expenses and your mortgage for the year, you have $6,000 in cash left over.
Your cash-on-cash return is $6,000 ÷ $105,000, which comes out to 5.7%. This number gives you a direct, unfiltered look at how hard your invested capital is working. If you want to dive deeper, our guide breaks down everything you need to know about https://flipsmrt.com/blog/what-is-a-good-cash-on-cash-return.
Return on Investment (ROI): The Big Picture of Profit
Return on Investment (ROI) takes a step back to give you the broadest view of a property's profitability. It's the long-game metric. Unlike cash-on-cash, ROI looks beyond just cash flow and factors in the equity you're building through loan paydown and market appreciation. It measures your total financial gain against your initial investment.
ROI is the perfect tool for evaluating a property's performance over its entire life cycle, from the day you buy it to the day you sell it. While cap rate is just a snapshot, tools like those for building an ROI calculator help paint a much wider picture. It helps you see the combined power of cash flow and long-term wealth building, making it a critical metric for strategic planning.
Pro Tip: For a quick deal comparison, cap rate is king. To see how your down payment is performing, use cash-on-cash. To measure total wealth creation over time, look to ROI. Smart investors use all three to get a 360-degree view.
These different metrics are crucial because the market itself isn't one-size-fits-all. Recent data shows huge cap rate differences between property types. For instance, multifamily and industrial properties have been averaging around 5.2-5.3%, while office and retail hover closer to 6.4%.
That 110-120 basis point spread might not sound like much, but it's massive. A property with $200,000 in NOI would be valued at $3.77 million as a multifamily asset but only $3.125 million as a retail space. That’s a ~17% valuation gap for the exact same cash flow.
Choosing the Right Metric for the Job
So, which metric should you use, and when? The answer depends entirely on the question you're trying to answer. A rental property cap rate calculator is your starting point, but knowing when to pivot to other tools is what separates the pros from the amateurs.
To help you decide which tool to pull out of your belt, we've put together a simple comparison table.
Comparing Key Investment Metrics: Cap Rate vs. Cash-on-Cash vs. ROI
This table breaks down the purpose, formula, and best use case for these three essential real estate metrics. Think of it as your cheat sheet for choosing the right tool for any analysis.
| Metric | What It Measures | Best Used For |
|---|---|---|
| Cap Rate | The property's unleveraged annual return relative to its price. | Quickly comparing multiple properties on an apples-to-apples basis before considering financing. |
| Cash-on-Cash Return | The annual cash flow you receive relative to your actual cash investment. | Evaluating the efficiency of your down payment and understanding your immediate cash returns with leverage. |
| Return on Investment (ROI) | The total profit (cash flow, equity, appreciation) over the entire investment period. | Assessing the long-term wealth-building potential of a property, especially when planning an exit strategy. |
By mastering these three key metrics, you can move beyond surface-level analysis. You'll be able to confidently evaluate not just the property itself, but how it fits into your personal financial strategy. This ensures every investment decision you make is backed by a complete and thorough understanding of its true potential.
Frequently Asked Questions (FAQ)
1. Can I trust the cap rate on a real estate listing?
No, you should always be skeptical. Think of the listed cap rate as a marketing number, not a final analysis. Sellers often use optimistic income figures and may omit key expenses like vacancy, maintenance reserves, or property management fees. Always calculate your own cap rate using conservative, independently verified numbers to get a true picture of the investment.
2. How does my mortgage affect the cap rate?
It doesn't! The cap rate formula is designed to measure a property's performance before debt. It shows the property's raw earning power, which allows you to compare different properties fairly. To understand how your specific loan terms (like your down payment and interest rate) impact your personal returns, you should calculate the Cash-on-Cash Return instead.
3. What is a "good" cap rate for a beginner?
A good cap rate depends entirely on the market, property type, and your risk tolerance, but a general range for beginners to target is often between 5% and 8%. This range typically indicates a property that can generate positive cash flow without being in an overly risky location or condition. However, always prioritize positive cash flow after all expenses, including your mortgage, are paid.
Ready to stop guessing and start analyzing properties with precision? Flip Smart removes the manual work, giving you instant valuations, renovation costs, and profit potential for any property in seconds. Make your next investment decision with data, not doubt. Analyze your first deal for free at https://flipsmrt.com.