So, what’s a good cash on cash return? The short answer most investors will give you is somewhere between 8% and 12%. But that’s not a hard-and-fast rule; think of it more as a solid starting point or a general benchmark.
This range helps you quickly gauge if a potential investment is worth a deeper look. In this guide, we'll break down exactly what that means, how to calculate it, and why it's a crucial number for anyone buying an investment property.
Understanding Your Investment’s Earning Power
When you're looking at a property, it’s easy to drown in a sea of numbers—purchase price, potential rent, property taxes, insurance. It gets overwhelming fast.
Cash on cash return cuts right through all that noise. It's a simple, powerful metric that tells you exactly how hard your invested cash is working for you, year after year.
Essentially, it answers one critical question: For every dollar I pull out of my own pocket for this deal, how many cents am I getting back in profit each year?
Why This Metric Matters So Much
Unlike other real estate calculations that might factor in a property’s total value or hazy future appreciation, cash on cash return is brutally honest. It focuses only on the actual cash you put in versus the cash you get back. This makes it incredibly useful, especially for new buyers, because it measures the performance of your capital in the here and now.
This metric lets you compare completely different types of properties on an even playing field. For instance, you might find that a lower-priced duplex actually delivers a much higher cash on cash return than a fancy single-family home, even if the house generates more total rent. It forces you to think about efficiency, not just raw numbers.
Quick Takeaway: A higher percentage means your money is working harder, generating more cash flow relative to what you invested. It's a crystal-clear indicator of a property's immediate profitability.
That 8% to 12% range serves as a great baseline for most deals. However, what's considered "good" can definitely shift depending on the type of property you're looking at. To get a better feel for this, check out some detailed real estate investment templates and calculations. Knowing these benchmarks helps you set realistic goals from day one.
Cash on Cash Return Benchmarks by Property Type
The "right" cash on cash return isn't one-size-fits-all. Different property types come with different levels of risk, effort, and potential reward. This table breaks down the typical return ranges you can expect, helping you align your goals with the right strategy.
| Property Type | Average Cash on Cash Return Range | Key Considerations |
|---|---|---|
| Multifamily (2-4 Units) | 6% - 10% | Stable income, but higher management effort. Lower risk due to multiple tenants. |
| Single-Family Rentals (SFR) | 5% - 8% | Lower cash flow but often higher appreciation potential. Easier to manage. |
| Short-Term Rentals (Airbnb) | 10% - 20%+ | Very high return potential but requires intensive, hospitality-focused management. |
| Self-Storage Units | 8% - 12% | Lower operating costs and less tenant turnover. A more passive investment. |
| Commercial Real Estate | 8% - 12% | Longer lease terms provide stability, but deals are more complex and require more capital. |
Remember, these are just averages. A killer deal in a hot market might blow these numbers away, while a fixer-upper in a slower area might start out lower. Your job as an investor is to know what a good target looks like for the asset class you're pursuing.
How to Calculate Your Cash on Cash Return
Figuring out the math behind cash on cash return is a lot simpler than most people think. It’s a clean, straightforward formula that cuts right through the noise, giving you a crystal-clear picture of how hard your money is actually working for you in a deal. Once you nail down the two main components, you'll be able to size up any property with confidence.
The core formula is just this: (Annual Pre-Tax Cash Flow / Total Cash Invested) = Cash on Cash Return
Let's pull apart each piece of that equation.
Finding Your Annual Pre-Tax Cash Flow
First up: Annual Pre-Tax Cash Flow. Don't let the term intimidate you. This is simply the money the property leaves in your pocket over an entire year, before you've paid any income taxes on it. Think of it as the raw profit after all the property-related bills are paid.
Here's a quick visual that shows how the main numbers fit together.
As you can see, it boils down to the cash coming in versus the cash you put in.
To get to this number, you just do some simple subtraction:
- Start with Gross Rental Income: This is the total rent you'll collect from your tenants over a 12-month period.
- Subtract Operating Expenses: Tally up all the costs to keep the lights on—property taxes, insurance, maintenance, repairs, management fees, you name it.
- Subtract Annual Mortgage Payments: This is the total amount you pay toward your loan (both principal and interest) for the year.
The number you have left is your Annual Pre-Tax Cash Flow. It’s the truest measure of a property's yearly earning power.
Defining Your Total Cash Invested
The second piece of the puzzle is your Total Cash Invested. This is where new investors often trip up, thinking it's just their down payment. In reality, it’s every single dollar that came out of your bank account to close the deal.
Key Takeaway: Your Total Cash Invested is the complete out-of-pocket expense you paid to buy the property and get it ready for a tenant. Getting this number right is critical for an accurate cash on cash calculation.
Your Total Cash Invested will almost always include:
- Down Payment: The big chunk of cash you pay toward the purchase price.
- Closing Costs: All those miscellaneous fees for things like the appraisal, inspection, title insurance, and loan origination. Expect this to be around 2-5% of the purchase price.
- Initial Repairs & Renovations: Any money you had to spend upfront to get the property rent-ready. This could be as small as a fresh coat of paint or as big as a full kitchen gut.
To calculate your return accurately, you have to understand how your financing impacts this number. For example, the Loan-to-Value (LTV) ratio directly determines your down payment, which is often the biggest part of your total cash invested.
A Quick Calculation Example
Let's run the numbers on a hypothetical duplex to see it in action.
- Purchase Price: $300,000
- Down Payment (20%): $60,000
- Closing Costs: $6,000
- Initial Repairs: $4,000
First, let's get your Total Cash Invested:
$60,000 (Down Payment) + $6,000 (Closing Costs) + $4,000 (Repairs) = $70,000
Easy enough. Now, let’s figure out the property’s cash flow for the year:
- Gross Annual Rent: $30,000 ($2,500/month)
- Annual Operating Expenses: $9,000
- Annual Mortgage Payments: $13,000
Next, calculate your Annual Pre-Tax Cash Flow:
$30,000 (Rent) - $9,000 (Expenses) - $13,000 (Mortgage) = $8,000
Finally, let's plug it into the formula:
($8,000 / $70,000) = 11.4% Cash on Cash Return
Not bad at all. In this scenario, for every dollar you put into the deal, you're getting back 11.4 cents in profit each year.
Running these numbers is the best way to compare different deals on an apples-to-apples basis. If you want to speed up the process and avoid manual math, a good real estate investment calculator can do the heavy lifting for you.
Analyzing a Real World Investment Example
Formulas are great, but nothing makes a concept click like seeing it applied to an actual deal. Let's walk through a real-world example of calculating the cash on cash return for a multifamily property so you can see how all the financial pieces fit together.
Imagine you've found a promising small apartment building. The numbers look good on the surface, but you need to know exactly what kind of return your cash will generate before you even think about making an offer.
Setting the Scene: The Property and Purchase Details
First, let's lay out the basic financials of the deal. We'll use round, realistic numbers to keep the math clean.
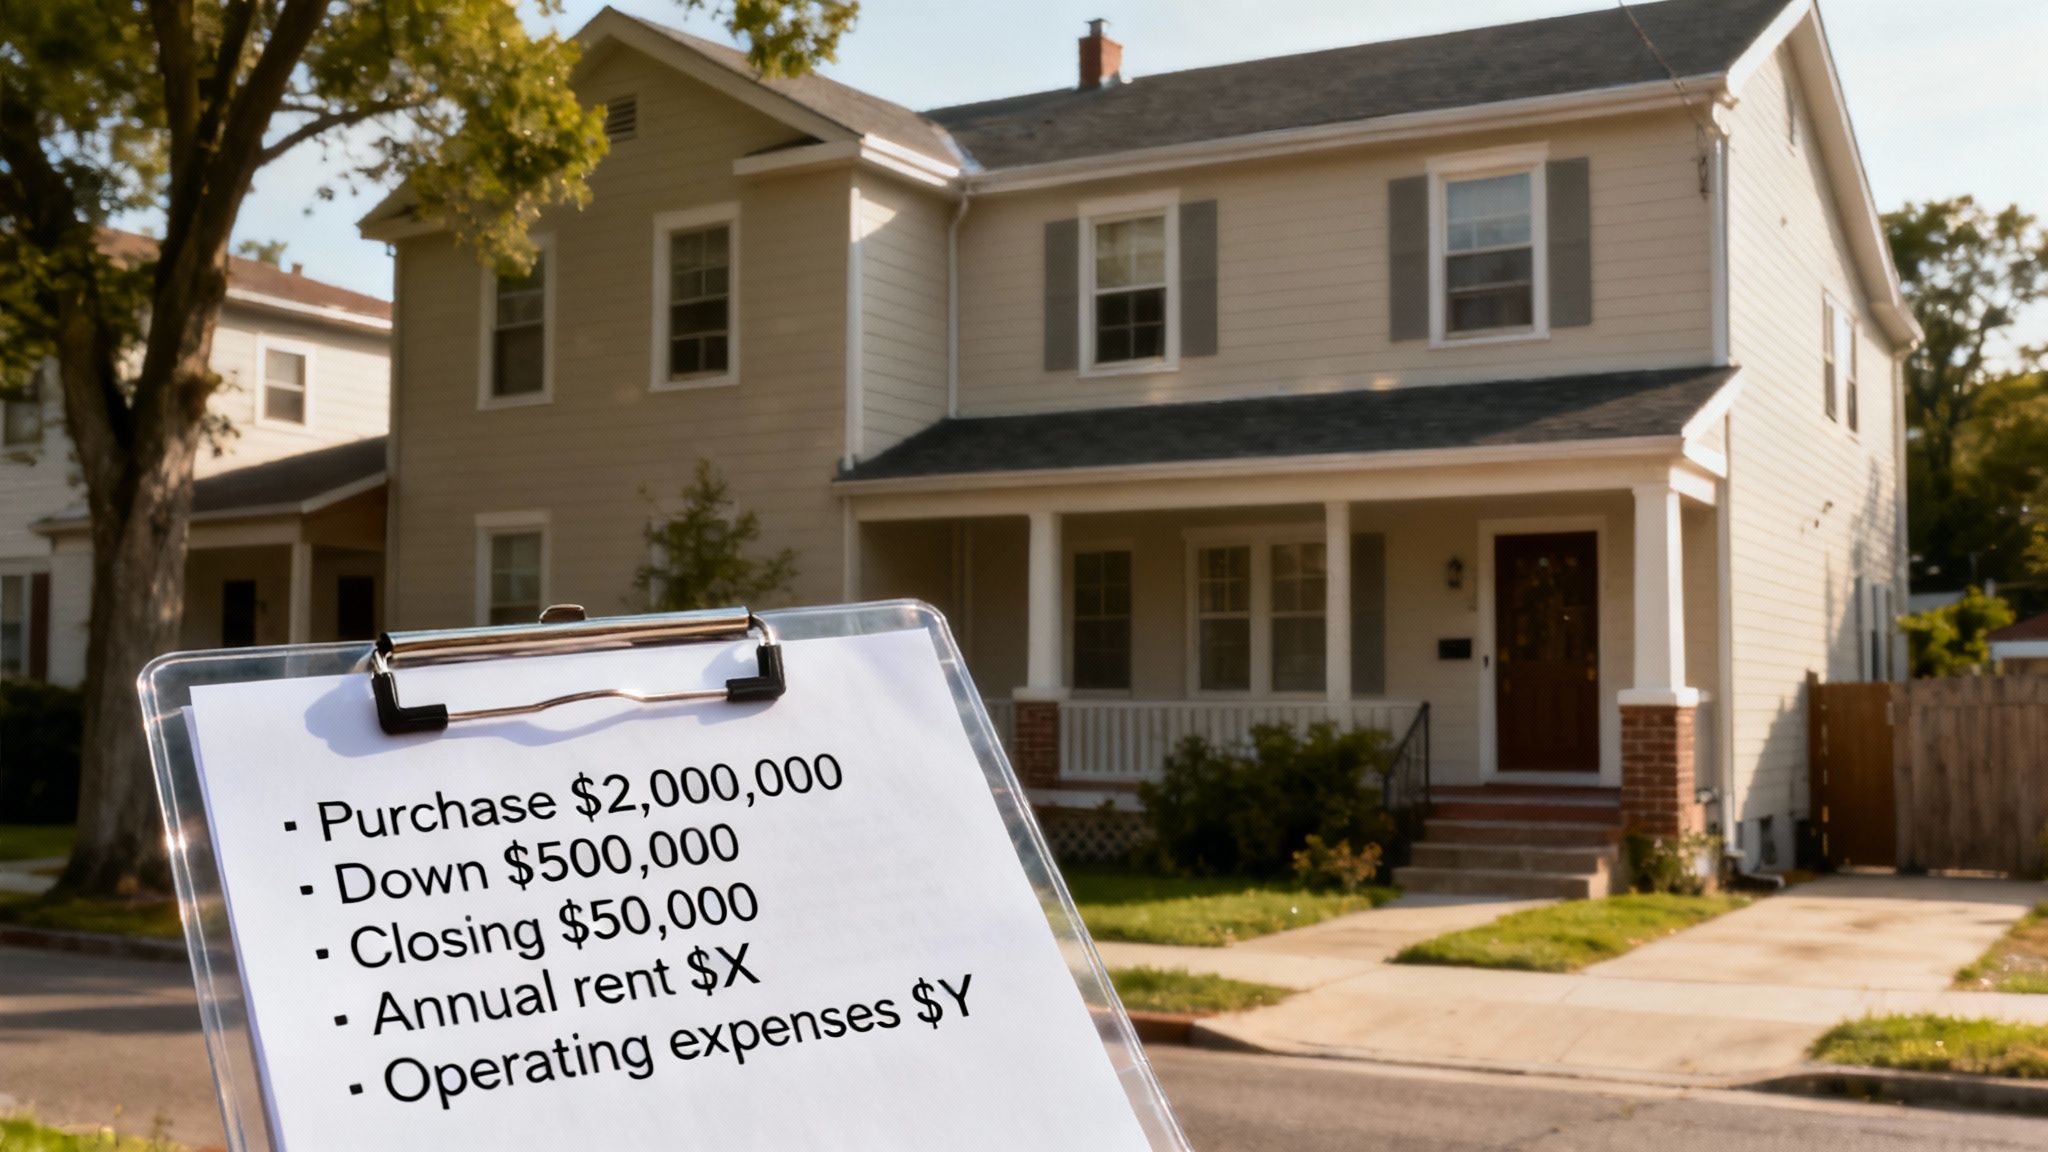
- Purchase Price:$2,000,000
- Down Payment: You decide to put 25% down, which is $500,000.
- Closing Costs: These fees (appraisal, legal, title, etc.) add up to another $50,000.
With these figures, we can pin down your Total Cash Invested. Remember, this is every single dollar you brought to the table to make the deal happen.
$500,000 (Down Payment) + $50,000 (Closing Costs) = $550,000 Total Cash Invested
This number is the foundation of our entire calculation—it's the "cash" in cash on cash return.
Breaking Down the Income and Expenses
Next, we need to get a handle on the property's annual cash flow. This is all about what comes in versus what goes out each year just to keep the lights on and the tenants happy.
Let's assume the following annual figures:
- Gross Rental Income: After analyzing the rent roll, you determine the property brings in $180,000 per year.
- Operating Expenses: This bucket includes property taxes, insurance, maintenance, and property management, totaling $70,000 annually.
- Annual Mortgage Payments: Your loan of $1,500,000 results in total mortgage payments of $50,000 for the year.
Now, we can find the Annual Pre-Tax Cash Flow.
The Formula in Action:
$180,000 (Gross Income) - $70,000 (Operating Expenses) - $50,000 (Mortgage Payments) = $60,000 Annual Pre-Tax Cash Flow
This $60,000 is the actual profit the property generates and puts back into your pocket over a year, before taxes.
Calculating the Final Return
We've got the two essential puzzle pieces: the annual cash flow and the total cash you put in. All that's left is to plug them into the formula.
($60,000 Annual Pre-Tax Cash Flow / $550,000 Total Cash Invested) = 0.109
To turn that into a percentage, we just multiply by 100.
0.109 x 100 = 10.9% Cash on Cash Return
In this scenario, the multifamily property delivers a 10.9% cash on cash return. This provides a clear, objective measure to compare against the industry benchmarks we’ve already talked about.
To help visualize how we got here, the table below breaks down the calculation step by step.
Sample Multifamily Investment Calculation
| Financial Item | Amount | Calculation Notes |
|---|---|---|
| Purchase Price | $2,000,000 | The agreed-upon sale price of the property. |
| Down Payment | $500,000 | 25% of the Purchase Price. |
| Closing Costs | $50,000 | Includes appraisal, legal, and other transaction fees. |
| Total Cash Invested | $550,000 | Down Payment + Closing Costs. |
| Gross Rental Income | $180,000 | Total annual rent collected from all units. |
| Operating Expenses | $70,000 | Annual costs for taxes, insurance, maintenance, etc. |
| Annual Mortgage Payments | $50,000 | Total principal and interest paid to the lender per year. |
| Annual Pre-Tax Cash Flow | $60,000 | Gross Income - Operating Expenses - Mortgage Payments. |
| Cash on Cash Return | 10.9% | (Annual Cash Flow / Total Cash Invested) x 100. |
This result falls squarely in that "good" to "great" range of 8-12%, making this a potentially strong investment opportunity. It shows exactly how your initial $550,000 is working to generate a healthy annual income.
Keeping track of these numbers is much easier when you use a purpose-built tool. You can find out more by checking out our guide on the best https://flipsmrt.com/blog/rental-property-analysis-spreadsheet to streamline your own calculations.
Key Factors That Influence Your Return
The cash on cash return formula is your starting line, not the finish line. In the real world, several dynamic factors can dramatically stretch or shrink that final percentage. Understanding these variables is what separates a good investor from a great one.
Think of it like baking a cake. The formula is your recipe, but the quality of your ingredients—your financing, property type, location, and management style—will ultimately determine how good it tastes. Let's break down the four key ingredients that have the biggest impact on your returns.
Your Financing Terms
How you pay for a property is just as important as what you pay for it. Your financing structure directly impacts both sides of the cash on cash return equation: your total cash invested and your annual cash flow.
- Down Payment: A smaller down payment means less cash invested upfront, which can seriously boost your return percentage. The catch? It also means a larger loan, leading to higher monthly mortgage payments that eat into your annual cash flow.
- Interest Rate: Even a small difference in your interest rate can change your monthly payment in a big way. A lower rate shrinks your annual mortgage costs, leaving more cash in your pocket and pushing your return higher.
- Loan Type: The loan you choose matters. An interest-only loan, for example, will result in much higher cash flow at the beginning (juicing your return) but doesn't build any equity. A traditional 30-year fixed loan has higher payments but gives you stability and peace of mind.
The goal is to find that sweet spot where you minimize your initial cash outlay without letting your mortgage payments swallow all your profit.
The Property Type You Choose
Not all properties are created equal when it comes to generating cash flow. Your choice between a single-family home and a multifamily building carries different risks and rewards, directly affecting your potential return.
Single-family homes often have lower initial cash flow but may offer stronger appreciation potential down the road. They are also generally easier to manage.
In contrast, multifamily properties (like a duplex or fourplex) tend to deliver higher cash on cash returns. With multiple rent checks coming in, the financial blow from a single vacancy is softened, leading to more stable and predictable income. But they also demand more intensive management and often come with higher maintenance costs.
Market Location and Demand
Real estate is famously all about "location, location, location," and for good reason. The economic health of your chosen market has a powerful effect on your investment's performance.
A strong local economy with steady job growth attracts new residents, which in turn fuels rental demand. High demand allows you to charge competitive rents and minimizes the time your property sits vacant. A market with low vacancy rates (typically below 5%) is a clear sign of a healthy rental environment where you have more pricing power.
Investor Insight: A property in a thriving neighborhood with growing demand might offer a 10% return, while an identical property in a stagnant market could struggle to hit 6%. Market fundamentals can absolutely make or break your investment.
Before you even think about making an offer, research local trends. Are major employers moving in or out? Is the population growing? Answering these questions helps you forecast your property's long-term income potential.
Your Property Management Strategy
The final key factor is how you decide to manage the property. Your choice between self-management and hiring a professional creates a direct trade-off between your time and your money, impacting your bottom line.
- Self-Management: Managing the property yourself eliminates the management fee (typically 8-12% of gross rents), which directly increases your annual cash flow and cash on cash return. But don't fool yourself—it requires a significant investment of your time to handle tenant screening, rent collection, and late-night maintenance calls.
- Hiring a Professional: A good property manager handles all the day-to-day headaches, making the investment truly passive. While their fee reduces your cash flow, they can often reduce vacancy periods and secure better rates on repairs, which helps offset their cost.
To get the full picture, you also have to consider all the ongoing expenses of ownership. Understanding the real cost of holding a property is vital for accurate projections. And remember, truly maximizing your income involves more than just collecting rent; it's about actively setting prices based on demand. For a deeper dive, understanding revenue management in rental properties is a crucial strategy that ensures you're leaving no money on the table.
Looking Beyond a Single Metric for Smart Investing
A good cash-on-cash return is a fantastic starting point for analyzing a deal, but it’s not the whole story. Think of it like a car's horsepower rating—it tells you something important, but you wouldn't buy a car without also checking its fuel efficiency, safety features, and reliability.
To make truly smart investment decisions, you need a few more tools on your financial dashboard.
While cash-on-cash return is perfect for measuring the performance of your actual cash, other metrics provide a more complete picture of the property's overall health and long-term potential. Let's look at a few essential ones every investor should know.
The Capitalization Rate or Cap Rate
What if you wanted to judge a property's profitability without financing getting in the way? That’s exactly what the Capitalization Rate (Cap Rate) does. It measures the unleveraged return on a property, as if you bought it with all cash.
The formula is straightforward: (Net Operating Income / Property Value)
Your Net Operating Income (NOI) is your Gross Rental Income minus all Operating Expenses, but it does not subtract mortgage payments. This makes Cap Rate an excellent tool for comparing the raw earning power of different properties in the same market, regardless of how an investor chooses to finance them.
Total Return on Investment or ROI
While cash-on-cash focuses solely on the cash flow you receive, Total Return on Investment (ROI) takes a much broader view. It accounts for all the ways a property can make you money over time, not just the annual profit.
Total ROI includes three key components:
- Cash Flow: The annual profit we’ve been discussing.
- Appreciation: The increase in the property's market value over the time you own it.
- Equity Buildup: The portion of your mortgage payments that goes toward paying down the loan principal, increasing your ownership stake.
ROI is typically calculated when you sell a property to measure the total profit against your initial cash investment. It answers the question, "After everything was said and done, how much did I truly make from this entire venture?"
An investment might have a modest 6% cash-on-cash return but a powerful 20% annualized ROI once you factor in appreciation and equity. This shows the difference between an income-focused play and a long-term wealth-building strategy.
Internal Rate of Return or IRR
For investors who want to get even more precise, the Internal Rate of Return (IRR) offers a more advanced look at profitability. This metric is a bit more complex, but its core function is to calculate the annualized rate of return on an investment by considering the timing of all cash flows—both in and out—over the entire life of the project.
Essentially, IRR tells you the exact percentage return you're earning each year, factoring in the time value of money (the idea that a dollar today is worth more than a dollar tomorrow). While new investors might not need to use IRR for their first few deals, it becomes incredibly valuable for comparing projects with different timelines and cash flow patterns.
Ultimately, knowing what is a good cash on cash return is just the first step. A truly great investment balances strong immediate cash flow (measured by cash-on-cash return), solid intrinsic profitability (measured by Cap Rate), and significant long-term growth potential (measured by ROI).
Using these metrics together gives you a 360-degree view, empowering you to build a resilient and profitable real estate portfolio.
Common Mistakes to Avoid When Calculating Your Returns
Running your numbers on a potential deal is exciting. It's easy to get caught up in the potential upside, but a few common slip-ups can turn a promising projection into a costly surprise. Getting this right from the start is critical.
Sidestepping these frequent pitfalls will help you build a forecast you can actually trust, preventing nasty financial surprises down the road.
Let’s look at the three most common mistakes new investors make and how you can easily avoid them.
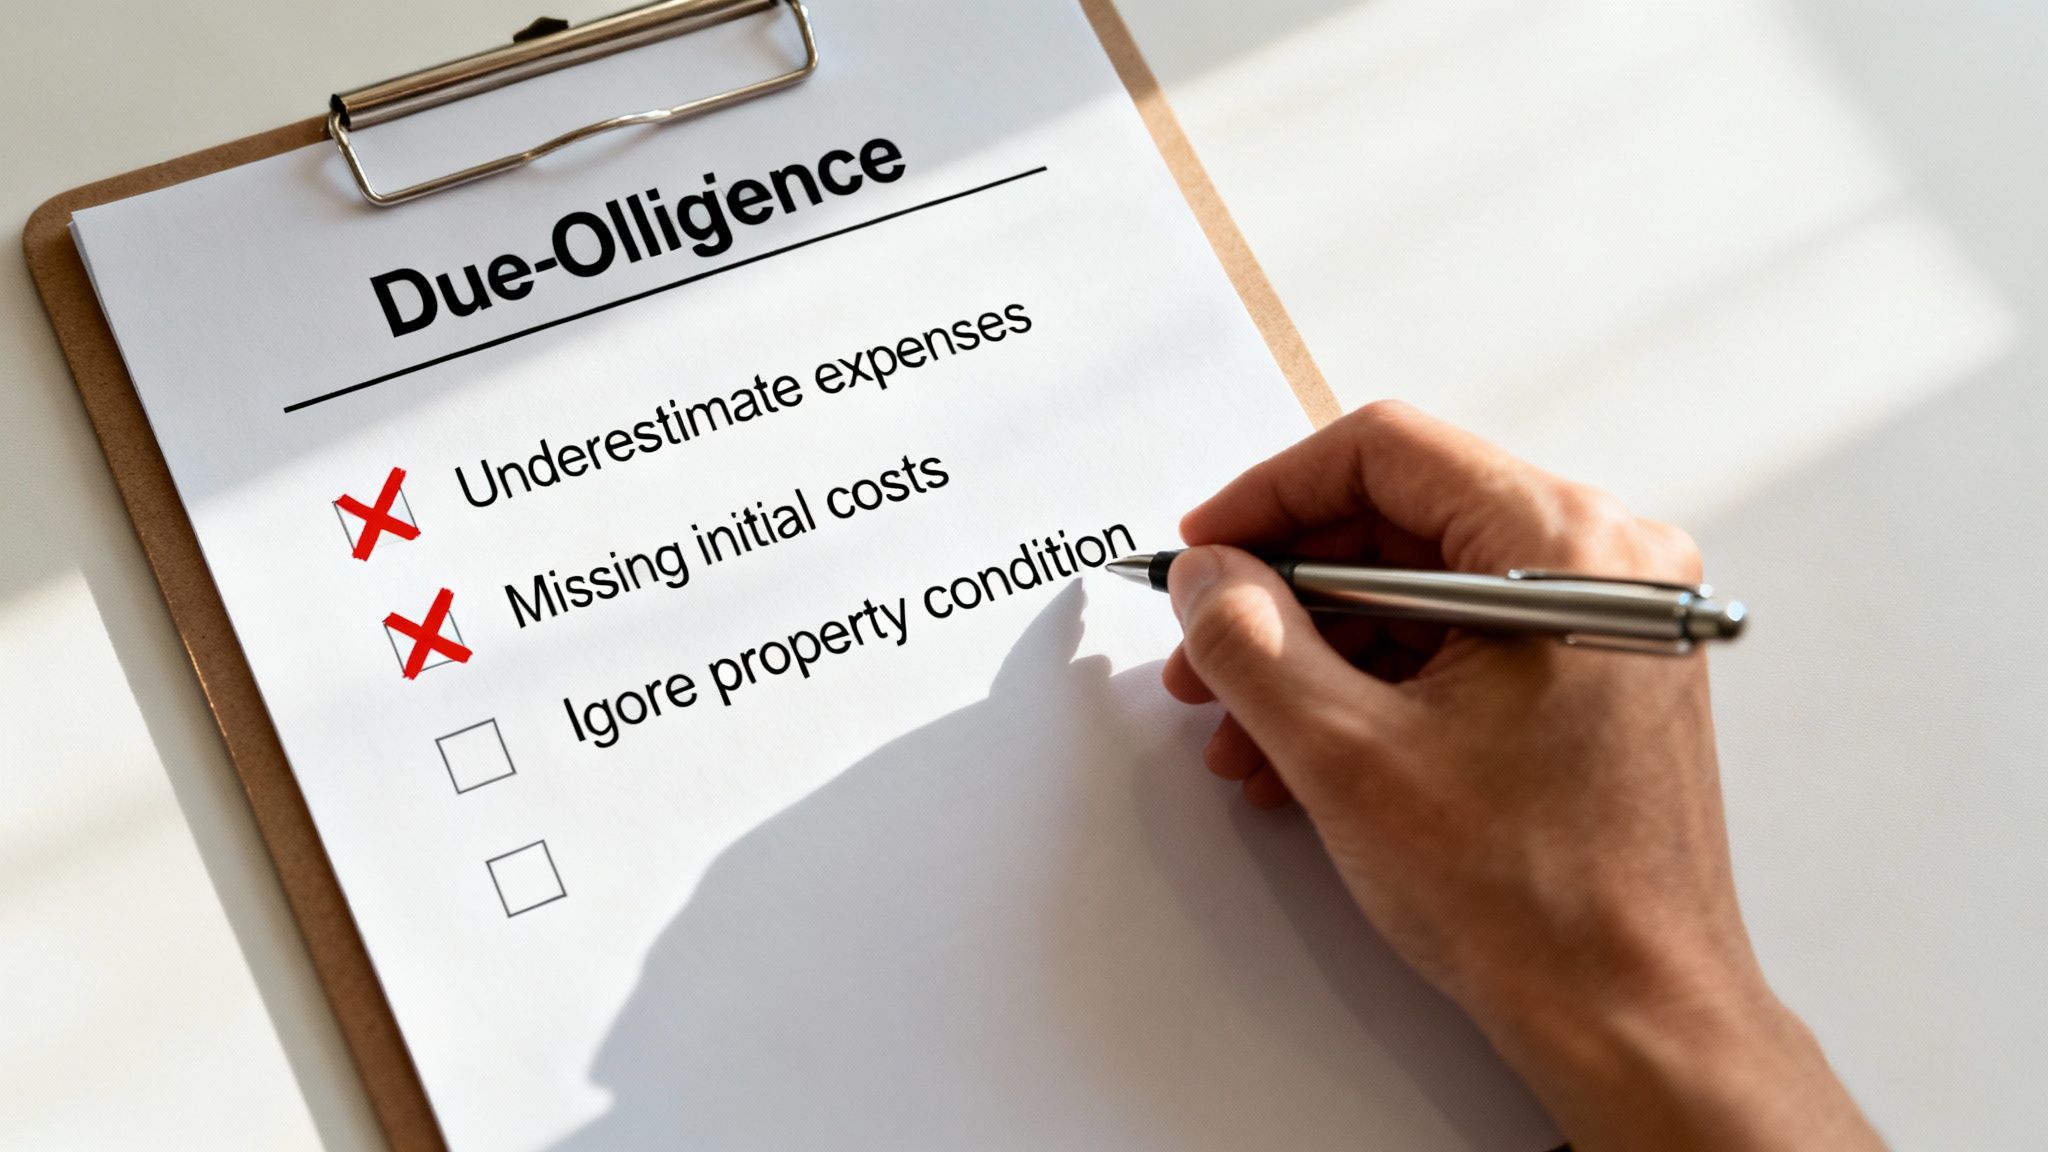
Underestimating Your Operating Expenses
This is, by far, the biggest trap for new and even some seasoned investors. It’s easy to remember the obvious stuff like property taxes and insurance, but the less-obvious, "invisible" expenses are what really eat into your profits. New investors almost always forget to budget for:
- Vacancy: No property stays rented 100% of the time. People move out. It takes time to find a new tenant. A conservative and safe estimate is to set aside 5-10% of your gross rental income to cover months when the unit is empty.
- Repairs and Maintenance: Things break. Faucets leak, garbage disposals jam, and tenants call you at 10 PM. Budgeting another 5-10% of your gross rent for these routine fixes is non-negotiable for a realistic projection.
- Capital Expenditures (CapEx): These are the big-ticket items that have a limited lifespan—think the roof, HVAC system, or water heater. They don’t break often, but when they do, it’s a huge bill. Setting aside an additional 5% of your rent in a separate fund ensures you’re not blindsided by a $10,000 replacement.
Forgetting All Your Initial Costs
The "Total Cash Invested" part of the formula isn't just your down payment. Forgetting to include every single out-of-pocket expense will make your return look way better on paper than it is in reality, giving you a dangerous false sense of security.
Your calculation must include every single dollar that left your bank account to acquire the property. This includes your down payment, all closing costs, inspection fees, appraisal fees, and any cash you spent on initial renovations or repairs to get it rent-ready.
Ignoring Obvious Red Flags
Sometimes, a deal just looks too good to be true on paper. A sky-high cash-on-cash return can be incredibly tempting, but it might be masking serious underlying problems with the property or the neighborhood. Don't get so focused on one shiny number that you overlook major warning signs.
A property might pencil out to a 20% projected return, but if it’s in a declining area with rising crime rates or needs a full foundation repair, that return is pure fantasy. You have to balance the spreadsheet with on-the-ground due diligence.
A healthy, real-world 10% return on a solid property is infinitely better than a phantom 20% on a crumbling one.
Frequently Asked Questions (FAQ)
Here are answers to a few common questions that come up when you're learning about cash on cash return.
What's the difference between cash on cash return and ROI?
Think of it this way: cash on cash return is your annual checkup. It measures the cash profit you get back each year compared to the actual cash you put into the deal. On the other hand, Return on Investment (ROI) is the final report card you get when you sell the property. It’s a bigger picture that includes your cash flow, the equity you’ve built, and any appreciation in the property’s value.
How can I increase my cash on cash return?
You can boost your return in a few practical ways. First, try to increase your rental income by making small upgrades or ensuring your rent is competitive for the area. Second, look for ways to lower your operating costs, like shopping for better insurance rates. Finally, if mortgage rates have dropped, refinancing your loan can lower your monthly payments and increase your annual cash flow.
Is a lower cash on cash return ever a good thing?
Sometimes, yes. In very high-growth markets, investors might accept a low (or even negative) cash on cash return. They are betting that the property's value will increase so much over time (appreciation) that it will make up for the low annual income. This is a higher-risk strategy that's more about long-term wealth building than immediate cash flow.
Ready to stop guessing and start analyzing properties with precision? Flip Smart provides the tools you need to calculate valuations, estimate renovation costs, and uncover profit potential in seconds. Make your next investment decision your best one. Analyze any property for free with Flip Smart.