Figuring out a rental property's true income isn't as simple as pocketing the rent check. The real calculation involves subtracting your total operating expenses (like taxes, insurance, and repairs) and accounting for potential vacancy losses from the property's gross potential rental income. Getting this right is what separates a profitable real estate investment from a money pit.
Why You Can't Afford to Guess on Rental Income

When you're looking at a potential investment property, that advertised monthly rent is just the starting line. One of the classic mistakes for new investors is multiplying that rent by twelve and calling it a day. That simple error can quickly turn what looks like a great deal into a financial headache.
The truth is that every rental property comes with a list of costs that chip away at that top-line number. Knowing how to accurately calculate your real rental income is fundamental. This guide is your step-by-step roadmap to understanding a property's true financial health.
Moving Beyond Surface-Level Numbers
We're going to peel back the layers and look past the advertised rent. It's time to dive into the essential metrics that seasoned pros use to evaluate any deal. This isn't just about crunching numbers; it's about getting a clear, unbiased picture of an investment's potential.
A proper analysis helps you do a few critical things:
- Avoid Overpaying: When you know the true income potential, you can make a much smarter offer on a property.
- Forecast Real Profitability: You'll be able to project your actual cash flow and return on investment with confidence, not just hope.
- Secure Financing: Lenders want to see these detailed calculations. In fact, many use a "75% rule" on gross rent to account for vacancies and maintenance when they're qualifying you for a loan.
- Compare Properties Apples-to-Apples: Using a consistent, accurate calculation method lets you stack different investment opportunities up against each other and see which one truly comes out on top.
Quick Takeaway: Think of this guide as your financial toolkit. It's designed to help you make smarter, data-driven decisions in your real estate journey. By the time you're done, you'll be able to confidently analyze any rental property and see the real story the numbers are telling—not just the one in the listing.
Establishing Gross Potential Rental Income
Your first step is to figure out a property's absolute best-case scenario income. What could this property bring in if everything went perfectly? This number is your Gross Potential Rental Income (GPRI), and it's the foundation for every other calculation.
Think of GPRI as the property's income ceiling—assuming every unit is rented every single day of the year at full market value, with all fees collected. It's an optimistic starting point, but a necessary one.
Finding Solid Rental Comps
The biggest piece of the GPRI puzzle is, of course, the rent. You cannot just take the seller's word for it or rely on what the current tenant pays. You have to do your own research to find a solid, defensible market rent.
This means pulling "comps," or comparable rental listings. You're looking for an apples-to-apples comparison to see what similar properties are actually renting for right now.
Look for recently rented properties in the immediate area with similar:
- Square footage
- Bedroom and bathroom count
- Age and condition
- Amenities (like in-unit laundry, parking, a yard, etc.)
Online platforms like Zillow, Rentometer, and Apartments.com are great for a quick overview. But here's a pro tip: call a couple of local property managers. They have boots-on-the-ground knowledge and can give you a gut-check on your numbers in just a few minutes. That kind of local insight is priceless.
Looking Beyond the Rent Check
While rent is the main event, it's rarely the only source of income. Experienced investors know that squeezing every drop of potential income out of a property is how you win. These other income streams are recurring charges tenants pay on top of their base rent.
Get creative and think about what else the property offers that can be monetized. Common examples include:
- Parking Fees: Is there a garage or a covered spot? You can often charge for it.
- Pet Rent: A monthly fee for tenants with pets, usually $25 to $75 per pet.
- Laundry Facilities: Coin-operated washers and dryers can be a nice little money-maker.
- Storage Units: Renting out extra closets or small garage spaces.
- Utility Reimbursements: In some markets and lease structures, you can bill back a portion of water, sewer, or trash services.
These smaller amounts might seem trivial, but they add up and are a critical part of a property's true income potential. Overlooking them means you're leaving cash on the table.
The global real estate rental market is massive. In the United States alone, the apartment rental industry is on track to hit $295.3 billion in revenue by the end of 2025. Smart landlords get their piece of that pie by optimizing every possible income stream. You can dig into the rental market size and its growth on IBISWorld.
Quick Takeaway: Your Gross Potential Rental Income isn't just the rent. It’s the grand total of all possible income from rent, fees, and other services before you account for a single expense or a day of vacancy.
Let's run the numbers on a realistic duplex to see how this works in practice.
Duplex Scenario Breakdown
- Unit A (2-bed/1-bath): Your market research shows it can command $1,600/month.
- Unit B (2-bed/1-bath): An identical unit, so it should also rent for $1,600/month.
- Parking: It has two covered parking spots. You can charge $50/month for each.
- Laundry: There’s a shared, coin-op laundry room that you estimate will generate $40/month.
Now, let's put it all together to find the monthly and annual GPRI.
Calculation:
- Total Monthly Rent: $1,600 + $1,600 = $3,200
- Total Monthly Other Income: ($50 x 2) + $40 = $140
- Total Monthly GPRI: $3,200 + $140 = $3,340
- Annual GPRI: $3,340 x 12 = $40,080
This $40,080 is your starting line. It's the perfect-world number that serves as the bedrock for all the realistic deductions and calculations that come next.
Uncovering Your Net Operating Income
Okay, you've got your Gross Potential Rental Income (GPRI)—that's your "perfect world" number. But let's be real: being a landlord isn't a perfect world. You're almost never going to collect 100% of the potential rent.
Tenants move out. A unit might sit empty for a month between leases. Sometimes, a payment is late. We have to bring our calculation back down to earth to get to the heart of a property's true performance.
The first step is turning that perfect-world GPRI into a much more realistic figure: the Effective Gross Income (EGI). Think of EGI as your potential income minus a dose of reality for vacancy and credit losses. It’s what you can actually expect to see hit your bank account.
From Potential to Effective Gross Income
Estimating your vacancy rate is part research, part local knowledge. A common rule of thumb for an initial analysis is to use a 5% vacancy factor. For our duplex example with an annual GPRI of $40,080, that means we'd subtract $2,004 ($40,080 x 0.05).
That leaves us with an EGI of $38,076.
But you can do better than a rule of thumb. For a more precise calculation, you need to know the local market. A quick call to a property manager in the area can give you this crucial insight. Ask them what the typical vacancy rate is for a property like yours in that specific neighborhood.
If the market is hot, your rate might be closer to 2-3%. In a slower market, it could easily be 8% or higher.
For our duplex, let's stick with the conservative 5% for now:
- Annual Gross Potential Income: $40,080
- Vacancy & Credit Loss (5%): -$2,004
- Effective Gross Income (EGI): $38,076
This $38,076 is the number we’ll use going forward. It's a much more sober and achievable income target to base our expense calculations on.
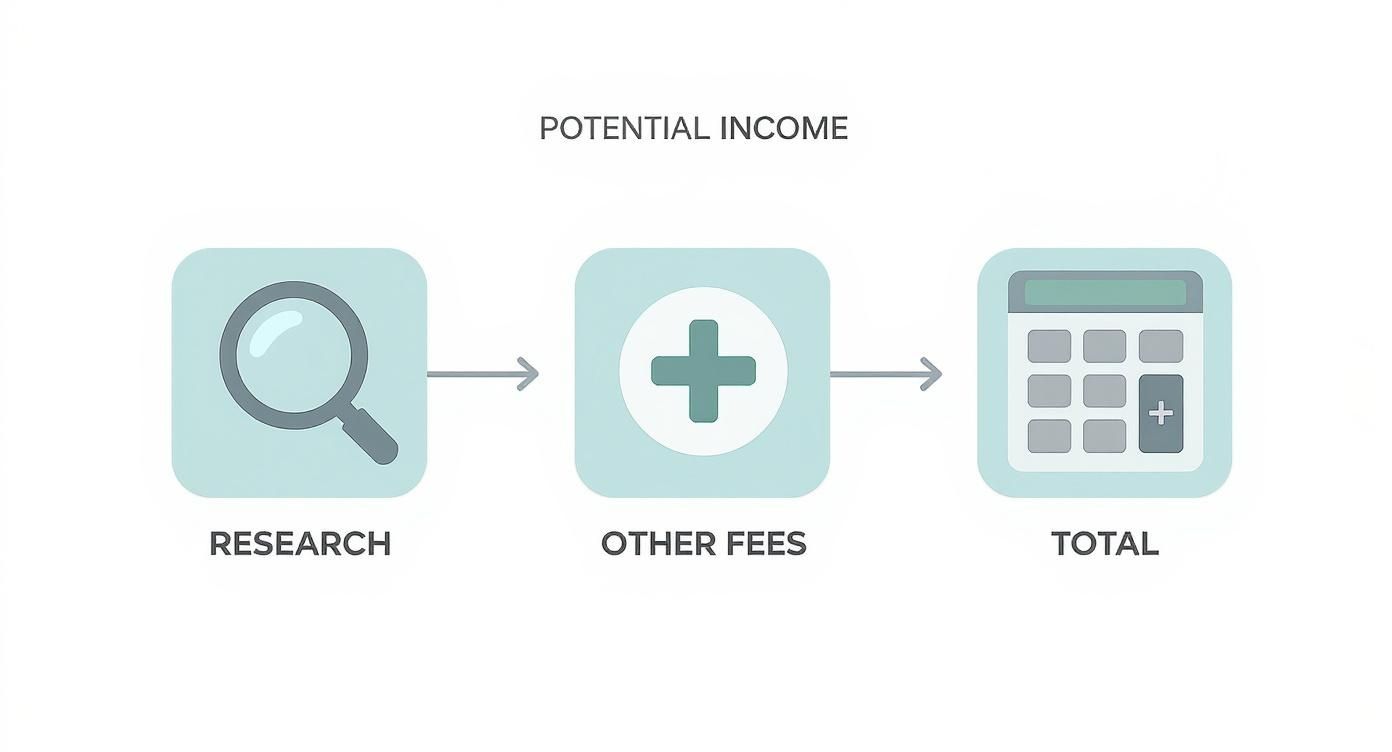
This flowchart nails a key point: your total income potential isn't just about rent. It's a combination of solid market research and accounting for all possible income streams.
Subtracting Operating Expenses
With our realistic EGI figured out, we can now calculate the Net Operating Income (NOI). This is one of the most important metrics in real estate because it shows you exactly how profitable the property is on its own, completely separate from your financing.
The formula is simple: NOI = EGI - Operating Expenses.
Operating expenses are all the recurring costs needed to keep the property running, maintained, and occupied. This is everything except your mortgage payment.
Key Insight: Your mortgage is a financing cost, not an operating one. Leaving it out of the NOI calculation allows you to compare the raw performance of different properties, regardless of how an investor chooses to finance them.
Common Operating Expenses for Rental Properties
Budgeting for expenses can feel like a guessing game, but most costs fall into predictable categories. The table below breaks down the usual suspects and provides a typical percentage of EGI you can use for your own estimates.
| Expense Category | Description | Estimated Annual Cost (% of EGI) |
|---|---|---|
| Property Taxes | A non-negotiable expense. Find the exact amount from county records or the property listing. | Varies (use actual numbers) |
| Property Insurance | You'll need a landlord policy, which is typically more expensive than a standard homeowner's policy. | 2-4% |
| Repairs & Maintenance | For everything from leaky faucets to patching drywall. Older properties will be on the higher end. | 5-10% |
| Property Management | Even if you self-manage, budget for this. It ensures the deal still works if you hire help later. | 8-10% |
| Utilities | Water, sewer, trash, and common area electricity that tenants don't typically pay. | 2-5% |
| Capital Expenditures | Money set aside for big-ticket items: the roof, HVAC, water heater. Don't skip this. | 5-10% |
Using these percentages gives you a solid framework for building a realistic budget, ensuring you don't get caught by surprise when big expenses pop up.
Putting It All Together for Our Duplex
Let's run the numbers for our example property using our EGI of $38,076. We'll plug in some realistic estimates for our operating expenses:
- Property Taxes:$4,500 (from local county records)
- Property Insurance:$1,500 (a typical quote for a landlord policy)
- Repairs & Maintenance (5% of EGI):$1,904
- Property Management (8% of EGI):$3,046
- Utilities (Water/Trash):$1,200
- Capital Expenditures (5% of EGI):$1,904
Adding those up gives us Total Operating Expenses of $14,054.
Now, we can find our NOI:
NOI = $38,076 (EGI) - $14,054 (Operating Expenses) = $24,022
This $24,022 is the magic number. It's the annual profit the property generates before we factor in any loan payments. This clean, powerful figure tells you the true earning potential of the asset itself.
If you want to get a firm handle on these and other critical calculations, our guide on essential real estate math formulas is the perfect next step.
Figuring Out Your Actual Cash Flow
While Net Operating Income (NOI) is a fantastic metric for judging a property's health on its own, it doesn't tell you the whole story. NOI shows what the property makes, but cash flow is what you actually get to keep. This is the money that lands in your bank account after every single bill is paid—including the biggest one of all: your mortgage.
The calculation is refreshingly simple. Just take your NOI and subtract your total mortgage payment, often called debt service. This final number is the moment of truth, revealing whether the property is putting money into your pocket each month or taking it out.
For any long-term "buy and hold" investor, positive cash flow isn't just a goal; it's the entire point. It's the passive income that builds wealth over time, completely separate from any market appreciation.
How Your Financing Choices Change Everything
Let's circle back to our duplex example. We already figured out it has an annual NOI of $24,022, which breaks down to $2,001.83 per month. Now, let's see what happens when we bring financing into the picture.
Imagine you're buying this duplex for $400,000 and you put 20% down ($80,000). That leaves you with a loan of $320,000.
If you lock in a standard 30-year fixed-rate mortgage at a 6.5% interest rate, your monthly principal and interest payment comes out to roughly $2,022.
Now, let's run the cash flow numbers:
- Monthly NOI: $2,001.83
- Monthly Mortgage (P&I): -$2,022.00
- Monthly Cash Flow: -$20.17
And just like that, our seemingly profitable property is now slightly cash flow negative. This single step shows how dramatically your financing terms can flip the script on a deal. A different down payment, interest rate, or loan term would give you a completely different result.
Investor Insight: A property can have a strong, positive NOI but still produce negative cash flow if the mortgage payments are too high. You must analyze the deal with your specific financing terms, not just the property's standalone performance.
Let's Talk Cash-on-Cash Return
So, if the property is barely breaking even, how do you measure the performance of the money you actually put into the deal? That’s where the cash-on-cash (CoC) return comes in. Investors love this metric because it's personal; it tells you the return you're getting on the cash you pulled out of your own pocket.
The formula is dead simple:
Cash-on-Cash Return = Annual Cash Flow / Total Cash Invested
Your "Total Cash Invested" is more than just your down payment. It’s every penny you spent to get the deal done.
- Down Payment: The initial chunk of money you put in.
- Closing Costs: Usually 2-5% of the purchase price, covering lender fees, title insurance, appraisals, etc.
- Upfront Repairs: Any money you spent immediately to get the property rent-ready.
Let's calculate this for our duplex. We'll assume your closing costs were 3% of the purchase price, or $12,000 ($400,000 x 0.03).
Calculating Total Cash Invested:
- Down Payment: $80,000
- Closing Costs: $12,000
- Total: $92,000
With an annual cash flow of -$242.04 (-$20.17 x 12), the cash-on-cash return is obviously negative. This doesn't automatically kill the deal—you're still building equity and might see appreciation—but it fails the primary test for an income-focused investor.
It's an immediate signal that you’d need to tweak your strategy. Could you negotiate a lower purchase price? Find a better interest rate? Put more money down? These are the questions CoC return forces you to ask.
If you want to go deeper, our complete guide on how to calculate cash flow on a rental property explores these scenarios in much more detail.
Evaluating Your Return on Investment
You've crunched the numbers and have a solid handle on the Net Operating Income (NOI) and the real cash flow. That’s the groundwork. Now it's time to zoom out and see what those numbers actually mean for your investment.
How does this specific property stack up against others? To answer that, we lean on two of the most critical metrics in any real estate investor's toolkit: Capitalization Rate (Cap Rate) and Return on Investment (ROI). These figures cut through the noise, allowing you to compare different deals with an unbiased, data-driven lens.
Mastering these will give you the confidence to know when you've found a genuine winner.
Using Cap Rate to Compare Properties
Think of the Cap Rate as the property's raw, unleveraged earning power. It tells you the annual return you'd make if you bought the property with all cash.
Because it completely ignores financing (mortgages, interest rates, etc.), it's the perfect tool for an apples-to-apples comparison between different investment opportunities.
The formula is clean and simple:
Cap Rate = Net Operating Income (NOI) / Purchase Price
Let's plug in the numbers from our duplex example. We calculated an annual NOI of $24,022 and are working with a purchase price of $400,000.
$24,022 (NOI) / $400,000 (Purchase Price) = 0.060 or 6.0%
Our duplex has a 6.0% Cap Rate. This means for every dollar of its value, the property generates six cents in annual profit before a single mortgage payment is made.
A higher cap rate often signals a higher potential return, but it can also come with higher risk. Conversely, a lower cap rate usually points to a safer, more stable property, often in a premium location. The real secret is comparing a property's cap rate to the local average for similar properties.
What Makes a Good Cap Rate
So, is a 6.0% cap rate any good? The only right answer is: it depends on the market.
In a high-demand, high-cost city like San Francisco, a 4% cap rate might be considered a fantastic find. But in a smaller, growing market in the Midwest, an investor might not even look at a deal under 8%. Market context is everything.
Local factors like rental affordability and economic trends play a huge role. For instance, while the U.S. national median rent hovered around $1,373 in late 2024, yields can swing wildly from one region to another.
Measuring Your Personal Return with ROI
While the cap rate gives you a feel for the property itself, Return on Investment (ROI)—specifically Cash-on-Cash Return in real estate—tells the story of your specific deal. It measures the return you're getting on the actual cash you pulled out of your pocket.
This metric is incredibly powerful because it bakes in your financing, giving you the clearest picture of your personal profitability.
Here's the formula:
ROI (Cash-on-Cash Return) = Annual Cash Flow / Total Cash Invested
In the previous section, we discovered our duplex was slightly cash-flow negative, with an annual cash flow of -$242.04. Our total cash invested, combining the down payment and closing costs, was $92,000.
-$242.04 (Annual Cash Flow) / $92,000 (Total Cash Invested) = -0.26%
That negative return is an immediate red flag. It shows that with our current financing, this property won't be putting cash in our pocket year one. This doesn't automatically kill the deal—you're still building equity as the loan gets paid down and could see appreciation—but for an investor focused on immediate income, it’s a clear signal to renegotiate the purchase price or hunt for better loan terms.
To get a better handle on this critical metric, check out our deep dive on how to calculate return on investment for a rental property. And if you're looking for ways to improve your numbers, you might explore these strategies to maximize passive income from rental properties.
By calculating both the Cap Rate and ROI, you get the complete story. The Cap Rate lets you objectively compare properties, while the ROI tells you exactly how the deal will work for you.
Frequently Asked Questions (FAQ)
What's the easiest way to estimate repair costs?
A good rule of thumb is the 1% Rule, which suggests budgeting 1% of the property's purchase price for annual maintenance. For a $300,000 house, that's $3,000 per year ($250/month). For a more accurate number, look at the age of major systems (roof, HVAC, water heater) and use your home inspection report to identify potential near-term expenses.
What is the difference between cash flow and NOI?
Net Operating Income (NOI) is the property's profit before the mortgage is paid (Income - Operating Expenses). It measures the asset's performance. Cash Flow is the money left in your pocket after the mortgage is paid (NOI - Mortgage Payment). It measures your personal profit. A property can have a positive NOI but negative cash flow if the loan payments are too high.
Is a high Cap Rate always a good thing?
Not necessarily. A high cap rate can indicate higher returns, but it often comes with higher risk, such as being in a less desirable location or needing significant repairs. A lower cap rate usually means a safer, more stable investment. The key is to compare a property's cap rate to the average for similar properties in the same local market to see if it’s a good deal.
Should I include potential appreciation in my calculations?
No, you should keep appreciation separate from your cash flow calculations. Metrics like NOI and cash flow measure a property's current financial performance based on real income and expenses. Appreciation is a long-term benefit that you realize only when you sell or refinance. Factoring in future value can give you a misleadingly optimistic view of the investment's health today.
Ready to stop crunching numbers by hand and start analyzing deals in seconds? Flip Smart takes the guesswork out of calculating rental income, cash flow, and ROI. Our platform automates the entire analysis process, giving you the accurate data you need to make confident investment decisions instantly. Discover a smarter way to invest at https://flipsmrt.com.