A basic spreadsheet might calculate potential profit, but it's a blunt instrument in a surgeon's world. Most templates you find online are dangerously simplistic. They completely ignore mission-critical variables like future capital expenditures and realistic vacancy rates, painting a rosy picture that can lead to disastrous investment decisions. This guide will walk you through building a professional-grade analysis tool, step-by-step.
Why Generic Spreadsheets Put Your Capital at Risk
Many investors start by "running the numbers" on a simple calculator or a free spreadsheet. It’s a start, but it's like navigating a new city with a map drawn on a napkin instead of using GPS. You might be heading in the right general direction, but you’ll miss all the crucial details—the one-way streets, the traffic jams, the shortcuts—that determine whether you arrive at your destination on time and under budget.
A generic approach almost always focuses on just two things: purchase price and gross rent. This kind of surface-level analysis can make two wildly different properties look identical on paper.
The Illusion of Identical Deals: A Practical Example
Imagine two single-family rentals. Both are for sale at $300,000, and both command a monthly rent of $2,500. A simple spreadsheet would spit out the same numbers and tell you they’re equally good deals.
This is where a professional financial model separates the amateurs from the pros. It forces you to dig deeper and account for the nuances that truly impact your bottom line:
- Capital Expenditures (CapEx): What if Property A has a 20-year-old roof and an aging HVAC unit, while Property B was just updated? A detailed spreadsheet makes you budget for these big-ticket replacements, revealing a massive future cost the generic template completely ignores.
- Vacancy Rates: Maybe Property A is in a top-tier school district with a waiting list of tenants. Property B is near a university campus with constant student turnover, leading to higher vacancy every summer. Factoring in a realistic vacancy rate for each scenario reveals a huge difference in actual annual income.
- Operating Expense Nuances: Think about older appliances that need constant repairs or subtle differences in local property tax rates. These small details can bleed your cash flow dry over time, but a basic analysis won't even prompt you to consider them.
The real goal is to move beyond simple, static calculations. You need to build a dynamic tool that actively protects your capital. A well-constructed spreadsheet doesn't just give you an answer; it forces you to ask the right questions in the first place.
This shift from amateur to professional analysis has never been more critical. The real estate market is constantly shifting, and savvy investors are always looking for an edge. The Emerging Trends in Real Estate® Global Outlook 2025 report even highlights an "increased premium on robust asset selection and improvement strategies."
A detailed, professional-grade analysis is no longer a luxury—it’s table stakes for success. You can learn more about how smart investors use automated property analysis to gain a competitive advantage.
Step 1: Assemble Your Core Data Inputs

A powerful real estate spreadsheet is only as good as the numbers you feed it. Before you even think about writing a formula, your first job is to hunt down the essential data that will be the bedrock of your entire analysis. Create a dedicated "Inputs" tab in your sheet for these numbers.
Getting one of these core numbers wrong is like using the wrong ingredient in a recipe. This data-gathering phase is all about grounding your projections in reality, not just wishful thinking.
Let's break down these core inputs into four key buckets.
Purchase Details and Financing
First, nail down every number related to buying the property. This is more than just the purchase price—it’s every dollar out of your pocket to close the deal.
- Purchase Price: The number on the contract.
- Closing Costs: A common oversight for new investors. Budget 3-5% of the purchase price for title insurance, attorney fees, and loan origination charges.
- Initial Renovation Costs: This is the variable that can completely sink a deal. To avoid a budget disaster, get real quotes from contractors and check out our guide on how to estimate renovation costs.
With acquisition costs pinned down, detail your financing. This is critical for calculating your mortgage and understanding your real leverage.
- Down Payment: The cash you're putting into the deal. Track this as a percentage or a raw dollar amount.
- Loan Amount: The total you're borrowing.
- Interest Rate & Loan Term: The rate from your lender and the life of the loan (e.g., 30 years).
Projecting Income
Now, what can this property actually earn? Being too optimistic here is the most common—and costly—mistake. You need realistic figures based on what the market is actually doing right now.
The biggest piece of this puzzle is your Gross Scheduled Rent. This is the total potential rent you could collect if the property was 100% occupied every single month. Jump on Zillow or talk to a local property manager to find solid comps. Don't forget to add in any Other Income, like fees for parking spots, coin-op laundry, or pets.
Estimating Operating Expenses
Finally, meticulously list every single anticipated operating expense. These are the recurring costs that keep the property running and are a direct hit to your cash flow.
You’ve probably heard of the 50% Rule, which suggests that your operating expenses will run about 50% of your gross operating income. It's a decent starting point for a quick napkin math, but for a real real estate investment analysis spreadsheet, a detailed line-by-line breakdown is always going to be more accurate.
Your expense list must include:
- Property Taxes: Go straight to the county assessor's website. It's the only truly accurate source.
- Insurance: Get real quotes for landlord coverage from an insurance agent.
- Vacancy: This is a real expense, not a hypothetical. I always plug in a 5-8% vacancy rate as a safe starting point for most markets. If you don't account for it, you're lying to yourself.
- Repairs & Maintenance: Things break. Budget 5-10% of gross rent for the ongoing upkeep.
- Property Management Fees: If you're not managing it yourself, this will typically be 8-12% of the rent collected by your pro.
- Utilities: List out any utilities you'll be covering, like water, sewer, or trash.
- Capital Expenditures (CapEx): This is for the big-ticket items—the new roof in 5 years, the HVAC system in 10. You have to set aside funds for this. I recommend another 5-10% of rent just for CapEx.
Step 2: Construct the Key Financial Formulas
Now for the fun part. With your core data neatly organized, it’s time to make those raw numbers talk. This is where your real estate investment analysis spreadsheet truly comes alive, using a handful of essential formulas to tell the real financial story of a property.
These calculations are the key performance indicators (KPIs) that experienced investors live by. They’re what separate a speculative gamble from a sound, predictable investment.
This visualization breaks down how your income and expenses flow directly into the net cash flow calculation. It's the heart of your analysis. The key takeaway here is that every single operating expense, from taxes to repairs, chips away at your final take-home profit.
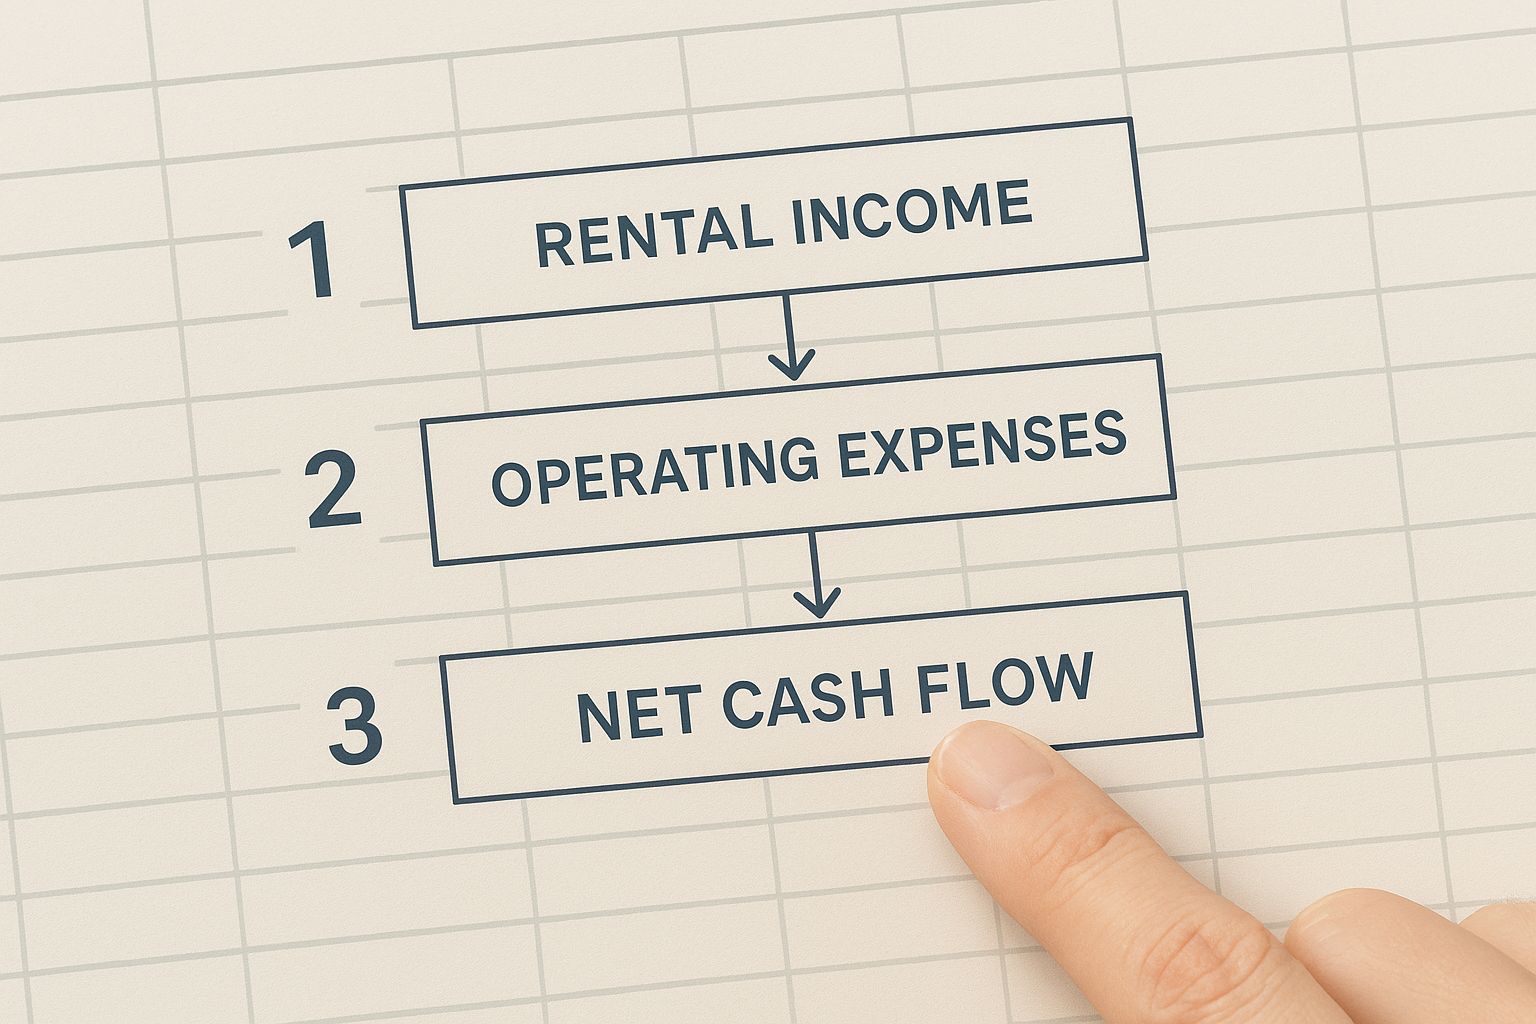
Understanding this relationship is crucial. Get it wrong, and your projections will be pure fiction.
Calculating Net Operating Income and Cash Flow
The first and most important formula you need is for Net Operating Income (NOI). Think of NOI as the property's profit before you factor in your mortgage. It's the purest measure of the asset's standalone performance.
The formula is refreshingly simple:
NOI = Gross Operating Income - Total Operating Expenses
Your Gross Operating Income is your total potential rent plus any other income, minus your vacancy allowance. From that number, you just subtract all your operating expenses. The result is your NOI.
Next up is Cash Flow, which is the money you actually get to put in your pocket. This is where your financing comes into play.
Cash Flow = NOI - Debt Service
"Debt Service" is just the industry term for your total mortgage payments (both principal and interest) over the course of a year. If this number is positive, the property is paying for itself and paying you.
Measuring Your Returns with Key Metrics
Once you have your NOI and cash flow figured out, you can calculate the metrics that really help you compare deals and understand your personal return on investment.
Capitalization Rate (Cap Rate): This is the go-to metric for comparing different properties, regardless of how they're financed. It measures the unleveraged rate of return.
- Formula:
Cap Rate = (Annual NOI / Purchase Price) * 100 - Actionable Insight: Use this to quickly compare properties in the same market. A higher cap rate generally means a higher return (and often, higher risk).
- Formula:
Cash-on-Cash Return (CoCR): This is arguably the most important metric for you, the investor. It measures the annual cash flow you receive relative to the total cash you personally invested.
- Formula:
CoCR = (Annual Cash Flow / Total Cash Invested) * 100 - Actionable Insight: This is your direct return on the cash you pulled out of your bank account. If you invested $50,000 and get $5,000 back in annual cash flow, your CoCR is a solid 10%.
- Formula:
By building both Cap Rate and CoCR into your spreadsheet, you get two distinct and powerful views. The Cap Rate gives you an objective, market-level assessment of the property itself. The CoCR gives you a subjective, personal assessment of how the deal performs for you, based on your specific loan and down payment.
Another useful, though much simpler, metric is the Gross Rent Multiplier (GRM). It’s a quick-and-dirty way to see if a property's asking price is in the right ballpark.
- Formula:
GRM = Purchase Price / Gross Annual Rent - Actionable Insight: A lower GRM is generally better. Use this for very rough initial comparisons, as it completely ignores operating expenses.
Mastering these calculations is non-negotiable for serious investors. If you want to dive even deeper, our detailed guide on essential real estate math formulas can provide even more context. By plugging these formulas into your spreadsheet, you transform it from a simple data sheet into a powerful decision-making machine.
Step 3: Forecast Long Term Growth and Equity
Your first year’s cash flow calculation is just the starting line. A truly powerful investment spreadsheet doesn’t just give you a snapshot—it builds a motion picture, projecting performance over a 5, 10, or even 20-year horizon. This is where you see the real wealth-building engine of real estate kick into gear.
A great deal builds wealth in two fundamental ways: through cash flow and equity growth. That equity comes from two places—the bank's portion shrinking as you pay down the loan, and the property's value rising over time. Your spreadsheet needs to model both.
Building Your Amortization Schedule
First, you need to track how your loan balance disappears over time. An amortization schedule does exactly that, breaking down each mortgage payment to show what’s going to interest versus what’s actually paying down your principal.
Every dollar that goes toward principal is a dollar of equity you've just created. You can build a simple table in your spreadsheet that maps out every payment over the life of the loan. This lets you pinpoint your exact loan balance at any point in the future—a critical number for calculating your total equity when you eventually sell.
Layering in Growth and Inflation Assumptions
With your loan paydown mapped out, get realistic about how your income and expenses will evolve. Numbers that stay flat year after year are a fantasy. Build these assumptions into your "Inputs" tab so you can easily adjust them.
Here are the key variables you need to build in:
- Rent Growth: Dig into historical rent appreciation for your specific market. For most stable areas, starting with a conservative 2-4% annual increase is a solid, defensible assumption.
- Expense Inflation: Your operating costs aren't static. Assume an annual inflation rate for things like property taxes, insurance, and maintenance. Tying this to the general rate of inflation, usually around 2-3%, is common practice.
- Property Appreciation: This one is the most speculative but also one of the biggest wealth drivers. Look at the long-term historical appreciation for the neighborhood. A 3-5% annual appreciation rate is a widely used benchmark for financial modeling.
By plugging in these dynamic variables, your spreadsheet transforms from a static calculator into a forward-looking crystal ball. It shows you exactly how a property generating $300 a month today could be spitting out thousands in annual cash flow and creating hundreds of thousands in equity a decade down the road.
This long-term view is exactly why so many serious investors are doubling down on real estate. A Deloitte outlook showed that about 75% of commercial real estate leaders planned to increase their investments, pointing to things like inflation hedging and stability. The only way to truly model those benefits is with a long-term forecast.
Step 4: Stress Test Your Deal with Sensitivity Analysis

Even the most detailed forecast is still just a single guess about the future. Pro investors know that hope isn't a strategy; preparation is. This is the moment your spreadsheet evolves from a calculator into a serious risk assessment tool. We're talking about sensitivity analysis.
The whole point is to put your deal through a financial stress test. You want to see how your returns hold up when your core assumptions inevitably get shaken up. Instead of fixating on one perfect outcome, you’ll model best-case, worst-case, and expected scenarios to truly understand the full range of possibilities.
Building a Simple Scenario Dashboard
The easiest way is to build a small "assumptions" dashboard right at the top of your "Inputs" tab. This is where you'll list out the core variables you want to play with. Your main financial model should pull its numbers directly from this dashboard.
Setting it up this way is a game-changer. You can change a variable in one single cell and watch the impact ripple through your entire analysis instantly. Focus on the variables that have the biggest impact on your bottom line.
Here are the big ones to start with:
- Vacancy Rate: What happens to your cash flow if the property sits empty for two months instead of one? Model how a jump from 5% to 10% vacancy impacts your annual cash flow.
- Interest Rate: How does a sudden 1% rate hike hammer your monthly payment and your cash-on-cash return? This is critical for any deal financed with variable-rate debt.
- Repair Costs: A surprise plumbing disaster can wipe out a year of profit. See what happens to your returns if your annual repair budget suddenly needs to be 50% higher than you planned.
- Rent Growth: What if the local rental market softens? Model a scenario with 0% rent growth for the first two years to see if the deal still makes sense.
By modeling these what-ifs, you're no longer just asking, "Will this deal make money?" You're answering the much more important questions: "How much could I lose if things go sideways?" and "What is my real margin of safety?"
Interpreting the Results
Once you've run these scenarios, you’ll have a clear range of potential outcomes for key metrics like cash flow and cash-on-cash return. For example, your analysis might show that in your "expected" case, the property generates $4,000 in annual cash flow.
But then you look at your worst-case scenario—with high vacancy and a major repair—and it spits out a -$1,500 loss. This insight is pure gold.
It tells you exactly how much of a buffer you need in your cash reserves. It helps you decide if the potential reward actually justifies the downside risk you’ve now put a number on. This final step gives you the clarity you need to make a truly informed, professional investment decision.
Answering Common Spreadsheet Questions
Even with the most dialed-in spreadsheet, a few questions always seem to crop up once you start plugging in real-world numbers. Let's tackle some of the most common ones.
A big one is always how to handle those unpredictable expenses—the surprise plumbing leak or the roof repair that wasn't on the bingo card. You budget for it systematically. The best practice is to set aside a percentage of your gross rent for Capital Expenditures (CapEx). I usually recommend starting with 5-10%. This builds a dedicated fund so you're paying for future repairs with the property's own income, not raiding your personal savings account.
What's the Best Software to Use?
For most investors getting started, the answer is simple: Microsoft Excel or Google Sheets. They give you all the power and flexibility you need without costing a dime upfront.
- Google Sheets: This is fantastic for collaboration. You can share your analysis with a partner or update your numbers from your phone while you're standing in a property.
- Microsoft Excel: Still the undisputed king for heavy-duty financial modeling. If you're building something incredibly complex with advanced data tables, Excel is your workhorse.
Honestly, both are great starting points. But many investors eventually hit a wall where the manual data entry and upkeep of a custom spreadsheet just becomes a massive time-suck. That's when dedicated property analysis software starts to look really appealing by automating most of the grunt work.
The most powerful analysis isn’t the one you run once; it’s the one you keep updated. For any property you own, plan on refreshing your spreadsheet at least once a year. Do it sooner if something major happens, like a tenant leaves or you get hit with a big tax reassessment. This keeps your projections from becoming wishful thinking.
Instead of wrestling with formulas and hunting for comps, what if you could analyze any property in seconds? Flip Smart does just that, providing instant valuations, renovation cost estimates, and profit potential to eliminate the guesswork. Make faster, smarter decisions by visiting https://flipsmrt.com to see how it works.