Buying a home can feel overwhelming, but what if you had a way to look past the fresh paint and nice staging to see a property's true story? That's what real estate data analysis is all about. Instead of just going with your gut, you use hard numbers to answer the tough questions, like, “Is this neighborhood’s value actually going to grow?” or “Am I about to overpay?”
Turning Numbers Into Confident Decisions

Think of yourself as a detective building a case for your new home. Your job is to gather all the clues—the data points—that reveal whether a property is a hidden gem or a potential money pit. This isn't some secret skill reserved for Wall Street experts; it's a practical approach any home buyer can learn to avoid making a costly mistake.
The whole point is to shift from an emotional reaction ("I love this kitchen!") to a logical conclusion ("This home is priced fairly for the neighborhood and meets our long-term goals"). It’s easy to fall in love with a charming backyard, but data helps you see the complete picture. It takes those overwhelming spreadsheets and market reports and turns them into a clear, actionable roadmap for your home-buying journey.
Why Data Matters More Than Ever
Today’s housing market is complex and moves fast. Factors like national interest rates and local zoning laws can affect the value of the home you're considering. Understanding these forces gives you a huge advantage.
Here's how a data-driven approach helps you:
- Validate your gut feelings: You can confirm if that "good feeling" about a neighborhood is backed by solid evidence of growth.
- Negotiate from a position of strength: Walk into negotiations armed with recent sales data to back up your offer.
- Spot long-term value: You can identify neighborhoods with real potential instead of just chasing today's hot spots.
- Avoid overpaying: It’s your best defense against paying more than a home is truly worth.
Building Your Analytical Mindset
Getting comfortable with data doesn't mean you need a degree in statistics. It's about learning to ask the right questions and knowing where to find the answers. As the market changes, knowing how to work with up-to-the-minute information is crucial. For anyone looking to go deeper, resources on mastering real-time data analytics offer great context on modern techniques.
Key Takeaway: Real estate data analysis replaces guesswork with a clear plan. It helps you find a home that fits your life and your budget, protecting you from an emotionally charged, financially risky decision.
Ultimately, this process is the foundation for your entire home-buying journey. For a deeper look, check out our guide on how data analytics is shaping real estate.
Decoding the Most Important Real Estate Metrics
To analyze a property like a pro, you need to speak the market's language. This means understanding a few key numbers that tell the real story behind a listing. Once you learn to decode these metrics, you can cut through the noise and spot the difference between a great deal and a potential headache.
We can break these essential numbers into two groups: "big picture" metrics about the overall market, and "zoom-in" metrics for a specific property.
Understanding the Broader Market Health
Before you look at a single house, you need to get a feel for the health of the city or neighborhood. Think of these metrics as the local real estate weather forecast.
- Median Home Price: This is the middle price point for all homes sold in an area. It's more reliable than the average price, which can be skewed by a few very expensive or cheap sales. A steadily climbing median price is a great sign of a healthy market.
- Days on Market (DOM): This tells you the average number of days a property is listed before an offer is accepted. A low DOM (under 30 days) signals a "seller's market" where homes sell quickly. A high DOM suggests a "buyer's market," with less competition and more room to negotiate.
- Inventory Levels: This is simply how many homes are for sale. Low inventory means fewer choices for buyers, which often leads to competition. High inventory gives buyers more power and can push prices down.
These three numbers tell you if you’re walking into a hot market or a cool one, so you can adjust your strategy.
Evaluating a Specific Property
Once you have a feel for the market, it's time to zoom in on the property itself. These are the nitty-gritty numbers that help you figure out a home's true value.
Price Per Square Foot is a simple way to compare the cost of similar-sized homes. Just divide the home's price by its square footage. For example, a 2,000-square-foot house listed for $500,000 has a price per square foot of $250. Comparing this to other nearby homes tells you if it's priced competitively.
Another crucial tool is analyzing Comparable Sales (Comps). These are recently sold properties in the same neighborhood that are a close match in size, condition, and features to the one you're eyeing.
Key Insight: Comps are the foundation of property valuation. An appraiser will use them to determine a home's official value for your mortgage, and you should use them to figure out a fair offer price. Your goal is to find at least three to five solid comps from the last 90 days.
For investors, the Capitalization Rate (Cap Rate) is king. This metric measures the potential return on an investment property by dividing its Net Operating Income (NOI) by its market value. While less critical for a primary home, understanding it can be useful if you plan to rent out the property someday.
Getting comfortable with these numbers is a must, which is why we put together a complete guide on the most important real estate math formulas every buyer and investor should know.
Essential Real Estate Metrics Explained
This table is your cheat sheet for the most important data points in property analysis, what they measure, and why they matter to you.
| Metric | What It Measures | Why It Matters For You |
|---|---|---|
| Median Home Price | The middle sale price in a market | Indicates overall market health and price trends. |
| Days on Market (DOM) | Average time a home takes to sell | Shows whether it's a buyer's or seller's market. |
| Price Per Square Foot | The cost of a property relative to its size | Allows for a direct, apples-to-apples price comparison. |
| Comparable Sales (Comps) | Prices of similar, recently sold homes | Helps you determine a fair offer price for a property. |
| Capitalization Rate | The potential return of an investment property | Helpful for investors or if you plan to rent out your home. |
By mastering both the big-picture and property-specific numbers, you stop guessing and start making decisions based on solid evidence.
Your Step-by-Step Checklist for Analyzing Any Home
Knowing the right metrics is one thing, but you need a simple, repeatable process to put them into action. This checklist takes the guesswork out of your analysis and ensures you don’t miss a critical detail before making an offer.
Think of it as your pre-flight check before one of the biggest financial decisions of your life. This approach walks you from the big picture all the way down to the fine print.
This infographic breaks down the core stages, showing how a solid analysis moves from a high-level market overview to a deep dive into the property itself.
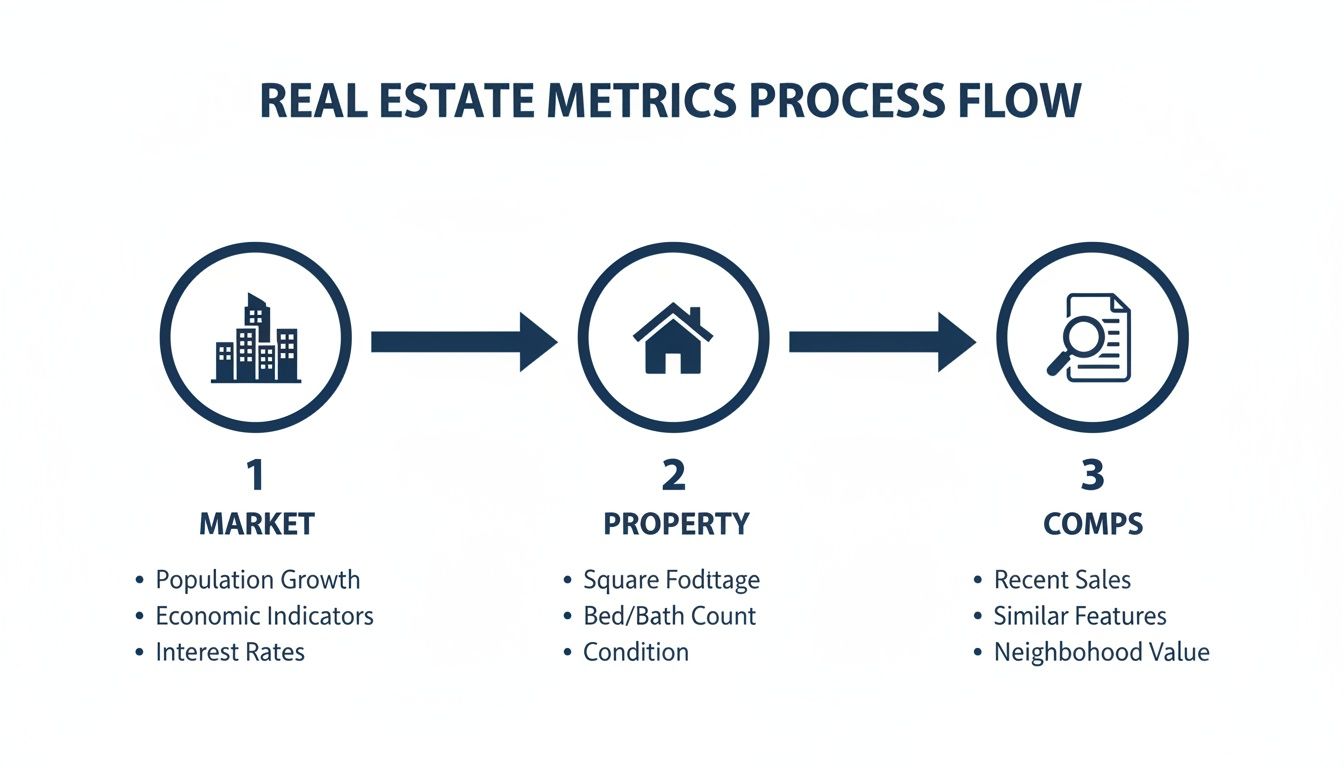
The key takeaway? A smart analysis always starts broad with the market, then narrows to the specific property, and is finally confirmed by comparing it to what’s actually selling nearby.
Step 1: Define Your "Must-Haves"
Before you even look at a single listing, know what you’re trying to accomplish. Your personal goals will determine which data points actually matter to you.
Are you looking for a long-term family home in a great school district? Or is your top priority a short commute to work? The answer changes everything.
- For Home Buyers: You’ll focus on quality-of-life metrics. This means things like school ratings, crime rates, your daily commute time, and proximity to parks and grocery stores. You'll also want to look at historical appreciation rates to understand the home's potential as a long-term asset.
- For Investors: The focus is purely financial. Metrics like cash flow, Return on Investment (ROI), and cap rates are most important. Neighborhood data is still crucial, but it's analyzed for its impact on rental demand.
Clarifying your objective upfront acts as a filter for every home you look at from here on out.
Step 2: Analyze the Broader Market
With your goals set, it’s time to look at the city or region. A fantastic house in a declining market can be a risky purchase, while an average house in a booming area could be a great long-term investment.
Look for trends in key indicators like job growth, population changes, and major development projects. A city that's attracting new companies and residents is likely to have a strong, stable housing market. When building your analysis workflow, understanding market trends is essential. For instance, a practical guide to analyzing sales data in Excel can help you uncover powerful insights from transaction histories.
Step 3: Investigate the Neighborhood
Once you've confirmed the city's health, narrow your focus to specific neighborhoods. This is where you get into the hyper-local data that directly impacts daily life and long-term value.
Your checklist for neighborhood analysis should include:
- School Ratings: Even if you don't have kids, strong schools are a major driver of property values.
- Crime Statistics: Local police departments often publish crime maps, giving you a clear picture of safety.
- Amenities: Check for proximity to grocery stores, parks, public transport, and restaurants.
- Zoning and Development: Look into any planned construction that could affect the area—for better or for worse.
This granular investigation helps you understand the character and trajectory of a neighborhood.
Step 4: Evaluate the Specific Property
Now, you can finally dig into the details of the house itself. This step is all about comparing the property to its direct competitors and assessing its physical and financial condition.
Pro Tip: Your most powerful tool here is the comparative market analysis (CMA). By finding at least three to five recently sold, similar properties (comps), you can establish a very accurate estimate of the home's fair market value.
Beyond comps, you’ll want to gather data on the property's condition, the age of major systems like the roof and HVAC, and any past permits for renovations. This information will be crucial during the home inspection phase.
Step 5: Run the Numbers for Your Budget
The final step is to pull all your data together into a clear financial projection. This is where you calculate your estimated monthly mortgage payment, including property taxes and homeowners insurance. Don't forget to factor in potential Homeowners Association (HOA) fees. This final check confirms whether the property is not just desirable, but truly affordable and aligned with your budget.
By following these five steps, you create a reliable framework that transforms complex real estate data into a clear, manageable process.
How Data-Driven Decisions Look in the Real World
Theory is one thing, but seeing real estate data analysis in action is where it all clicks. It’s the moment when numbers on a spreadsheet stop being abstract and start guiding someone to a home they love.
Let’s walk through two stories that show just how powerful a data-driven approach can be.
Case Study 1: The First-Time Home Buyer
Meet Sarah and Tom. They were ready to buy their first home but were completely overwhelmed by the sheer number of neighborhoods in their city. Their initial search was an emotional rollercoaster—they'd see a house with a charming porch and immediately start picturing their future, with no idea if the area was a smart long-term move.
So, they switched to a data-first approach, focusing on three metrics that mattered most to them:
- School District Ratings: Using public data, they filtered out any neighborhood that didn't meet their minimum quality score. Instantly, their search area became manageable.
- Commute Times: Tom mapped out rush-hour commute times from each remaining neighborhood. Their hard limit was 45 minutes, which eliminated several areas that looked close on a map.
- Historical Appreciation: Finally, they looked at the 5-year property value trends for their shortlist. One area stood out with a steady, healthy appreciation rate of 4-6% each year—a clear sign of strong, stable demand.
Armed with this data, they focused their house hunt on one well-vetted area. When they found a home they loved, they made an offer with total confidence, knowing it was a sound financial decision backed by a solid analytical foundation.
Case Study 2: The Savvy Duplex Investor
Now, let's look at Maria, an investor aiming to buy her first rental property. Her goal was clear: find a duplex that would generate positive cash flow from day one. Instead of getting lost in endless listings, she used a disciplined data analysis workflow.
First, Maria identified three up-and-coming neighborhoods with high rental demand. Then, for every duplex that hit the market, she ran the numbers through a detailed financial spreadsheet.
Her analysis included:
- Rental Comps: She researched what similar units in the area were renting for to accurately project her income.
- Vacancy Rate: She didn't assume 100% occupancy, instead building in a conservative 8% vacancy rate for tenant turnover.
- Expense Projections: She estimated all costs—property taxes, insurance, maintenance (budgeting 1% of the property's value annually), and management fees.
Investor Insight: Maria’s spreadsheet revealed that one duplex, though priced a bit higher, offered dramatically better cash flow. The rents were higher, and the property was in better shape, meaning lower initial repair costs. She made a competitive offer, knowing her numbers were rock solid.
This kind of disciplined approach is more relevant than ever. Global real estate markets are constantly shifting, and data provides clarity. You can explore these global real estate trends and tactics to see how data informs investment strategies on a much larger scale.
These stories highlight a simple truth: whether you're buying a forever home or a cash-flowing asset, a structured, data-driven process is the clearest path to success.
Essential Tools for Your Real Estate Analysis Toolkit

You don’t need a degree in data science to run a solid real estate data analysis. In fact, some of the most powerful tools out there are free and easy to find, giving you the power to make smarter decisions without a massive learning curve.
The goal is to find tools that fit your needs, so you can spend less time hunting for information and more time analyzing it.
Foundational Free Platforms
For most home buyers, the best place to begin is with the big, free platforms that already pull together tons of real estate data. These are your go-to for an initial look at a property or neighborhood.
- Zillow and Redfin: These sites are fantastic for a quick overview. You can instantly find property details, sales history, tax info, and neighborhood stats like school ratings and Walk Scores. Their value estimates (like the Zestimate) are a decent starting point, but always verify them with your own comps.
- Realtor.com: This one is often praised for data accuracy since it pulls directly from local MLS listings. It's another must-have for tracking what's for sale and what has recently sold.
Quick Takeaway: Use free platforms to get a baseline understanding of a property and its neighborhood before you commit to more time-consuming research.
Government and Public Data Sources
When you need to see the bigger picture, government websites are a goldmine of demographic and economic information that helps you understand the long-term health of an area.
- U.S. Census Bureau: An invaluable resource for tracking population growth, median household income, and other demographic shifts that fuel housing demand.
- Local County Websites: Your county assessor’s or recorder’s office website almost always has a searchable database of property tax records, official sales data, and zoning info. This is where you find the official story.
This kind of data provides crucial context. A neighborhood with rising incomes and a growing population is a much safer long-term bet than one where those trends are flat.
Advanced Analysis and Automation Tools
Once you're ready to get serious, specialized software can automate the heavy lifting and deliver deeper insights. These platforms are designed to streamline your workflow and give you a professional-grade analysis.
For a complete look at what's out there, our guide on real estate analysis software breaks down the best options.
Tools like Flip Smart can analyze a property’s potential ROI, estimate renovation costs, and calculate cash flow in seconds. It turns hours of manual spreadsheet work into just a few clicks, allowing you to evaluate more deals, faster, and with way more confidence.
Common Data Analysis Pitfalls and How to Avoid Them
Knowing the right steps for a solid real estate data analysis is only half the battle. Just as important is knowing the common traps that can lead to a bad decision.
By recognizing these common mistakes ahead of time, you can navigate your analysis with a clear head and avoid costly blunders.
Getting Stuck in "Analysis Paralysis"
This is the classic trap of overthinking. You have dozens of spreadsheets and endless browser tabs open, but you become so overwhelmed that you never actually make a decision. The goal of data is to inform a decision, not become a research project.
How to Avoid It:
Set deadlines for your research. Give yourself a specific timeframe—say, one week—to analyze a property. When time's up, make a call: move forward with an offer or move on.
Key Insight: Remember the 80/20 rule. You'll get 80% of the insights you need from 20% of the most critical data points (like recent comps, neighborhood trends, and repair estimates). Don't let the final 20% paralyze you.
Relying on Outdated or Incomplete Data
The real estate market moves fast. A comparative market analysis that was spot-on three months ago might be useless today, especially if interest rates or inventory have shifted. Making a decision based on old information is a recipe for disaster.
How to Avoid It:
Always prioritize the freshest data. When pulling comps, stick to properties sold within the last 90 days. Make it a habit to refresh your key market data weekly if you're actively hunting for a home.
Ignoring the Qualitative Factors
Numbers tell a huge part of the story, but they don't tell the whole story. Data won't tell you about the neighbor’s dog that barks all night or that the street is a major shortcut for morning traffic.
How to Avoid It:
Balance your quantitative analysis with on-the-ground intelligence.
- Visit the property at different times of day—morning, evening, and on the weekend.
- Walk the neighborhood to get a feel for its vibe.
- Talk to potential neighbors if you get the chance. Ask them what they love about living there.
This "boots-on-the-ground" intel provides crucial context you'll never find in a spreadsheet.
Focusing on a Single Metric
It’s easy to get tunnel vision on one number. A home buyer might get laser-focused on a low list price, overlooking sky-high property taxes and HOA fees that will crush their monthly budget.
How to Avoid It:
Always take a holistic view. A great home performs well across several key metrics, not just one. Create a checklist to ensure you’re evaluating all the important angles—from financial viability and location quality to the physical condition of the property itself. This forces you to see the big picture.
Frequently Asked Questions (FAQ) for Home Buyers
Jumping into real estate data can bring up a lot of questions. Here are clear answers to some of the most common concerns for new home buyers.
How much data do I really need to look at?
You don't need to drown in spreadsheets. For most home buyers, a focused approach is best. Concentrate on gathering 3-5 strong comparable sales (comps) from the last 90 days, understanding key neighborhood stats (like school ratings and crime rates), and having a firm grasp of your own budget. This core information provides about 80% of the insight you need without causing "analysis paralysis."
Can I trust online home value estimates like the Zestimate?
Think of online estimates as a helpful starting point, not a final answer. These algorithms are great for getting a ballpark figure, but they can't see important details like a brand-new kitchen or a roof that needs replacing. Always use these estimates as one tool among many, and rely more heavily on a comparative market analysis (CMA) from your real estate agent and your own research into recent sales.
What's the most important number for a first-time home buyer?
While investors focus on metrics like cash flow, your priorities are different. For a home you'll live in, focus on data that points to long-term value and your quality of life. The most important metrics for you are often:
- School District Ratings: Strong schools are a major driver of property values, even if you don't have kids.
- Property Tax Rates: This directly impacts your monthly payment, so it's a critical part of your budget calculation.
- Historical Appreciation Trends: Look at a neighborhood's 5-year value history to see if it shows stable, healthy growth.
Stop drowning in spreadsheets and start making smarter, faster investment decisions. Flip Smart analyzes any property in seconds, giving you valuations, rehab costs, and profit potential without the guesswork. Find your next winning investment at https://flipsmrt.com.