Data analytics in real estate isn't just about crunching numbers. It's about using historical data, proven algorithms, and statistical models to make smarter, evidence-based investment decisions. It’s the process of turning raw information into clear, actionable insights that help you pinpoint high-growth markets, value properties accurately, and see future trends before they happen.
This data-driven approach replaces expensive guesswork with a repeatable strategy, giving you a powerful competitive advantage in any market condition.
Why Data Replaced Gut Feelings in Real Estate
For decades, real estate investing was a mix of experience, local knowledge, and pure intuition. The best investors seemed to have a "gut feeling" for a good deal. While that instinct still has its place, today's market is far too complex and fast-moving to rely on intuition alone.
This is where data analytics comes in—not as a replacement for experience, but as an essential upgrade.
Think of an experienced pilot. They could try to fly just by looking out the window, but they use a sophisticated dashboard for a reason. Instruments give them precise data on altitude, speed, and weather, letting them make critical adjustments and avoid turbulence.
Navigating Market Complexity with Data
Data analytics is that dashboard for a real estate investor. It provides the instruments you need to see beyond the surface and understand the real forces shaping the market. Instead of just feeling like a neighborhood is on the rise, data can prove it with hard evidence.
Modern property investing is influenced by countless variables that are impossible to track in your head. These include:
- Economic Indicators: Things like interest rates, employment growth, and inflation have a direct impact on property values and what buyers can afford.
- Demographic Shifts: Population migration, income levels, and generational trends dictate housing demand in very specific areas.
- Local Market Dynamics: Inventory levels, days on market (DOM), and school district ratings create unique micro-markets with hidden opportunities.
Relying on gut feelings in this environment is like trying to navigate a storm without a compass. Data gives you the clarity and direction to make confident, strategic moves instead of just hopeful guesses.
The Shift to Strategic Investing
Ultimately, the rise of data analytics marks a fundamental shift from reactive speculation to proactive, evidence-based investing. It’s about moving from asking, "Is this a good deal?" to definitively answering, "Here's why this is a good deal, and I have the data to prove it."
By digging into the data, investors can uncover hidden opportunities that others miss, accurately assess risks before putting capital on the line, and secure more predictable returns. This strategic approach turns market uncertainty into a competitive edge, ensuring your decisions are grounded in fact, not just a feeling. It’s the new standard for anyone serious about building wealth through property.
The Three Levels of Real Estate Data Analysis
Data analytics in real estate isn't some monolithic, one-size-fits-all process. It’s better to think of it as a journey, one that unfolds in three distinct stages. Each level builds on the last, answering a more complex question and turning raw data into a real strategic advantage for investors.
Getting a handle on these three levels—Descriptive, Predictive, and Prescriptive—is the key to understanding how savvy investors move from just looking at past performance to making sharp, data-backed decisions that actually shape their future. It's the difference between being a historian, a forecaster, and ultimately, a strategist.
This is a great visual breakdown of how different data sources flow together to create those powerful insights.
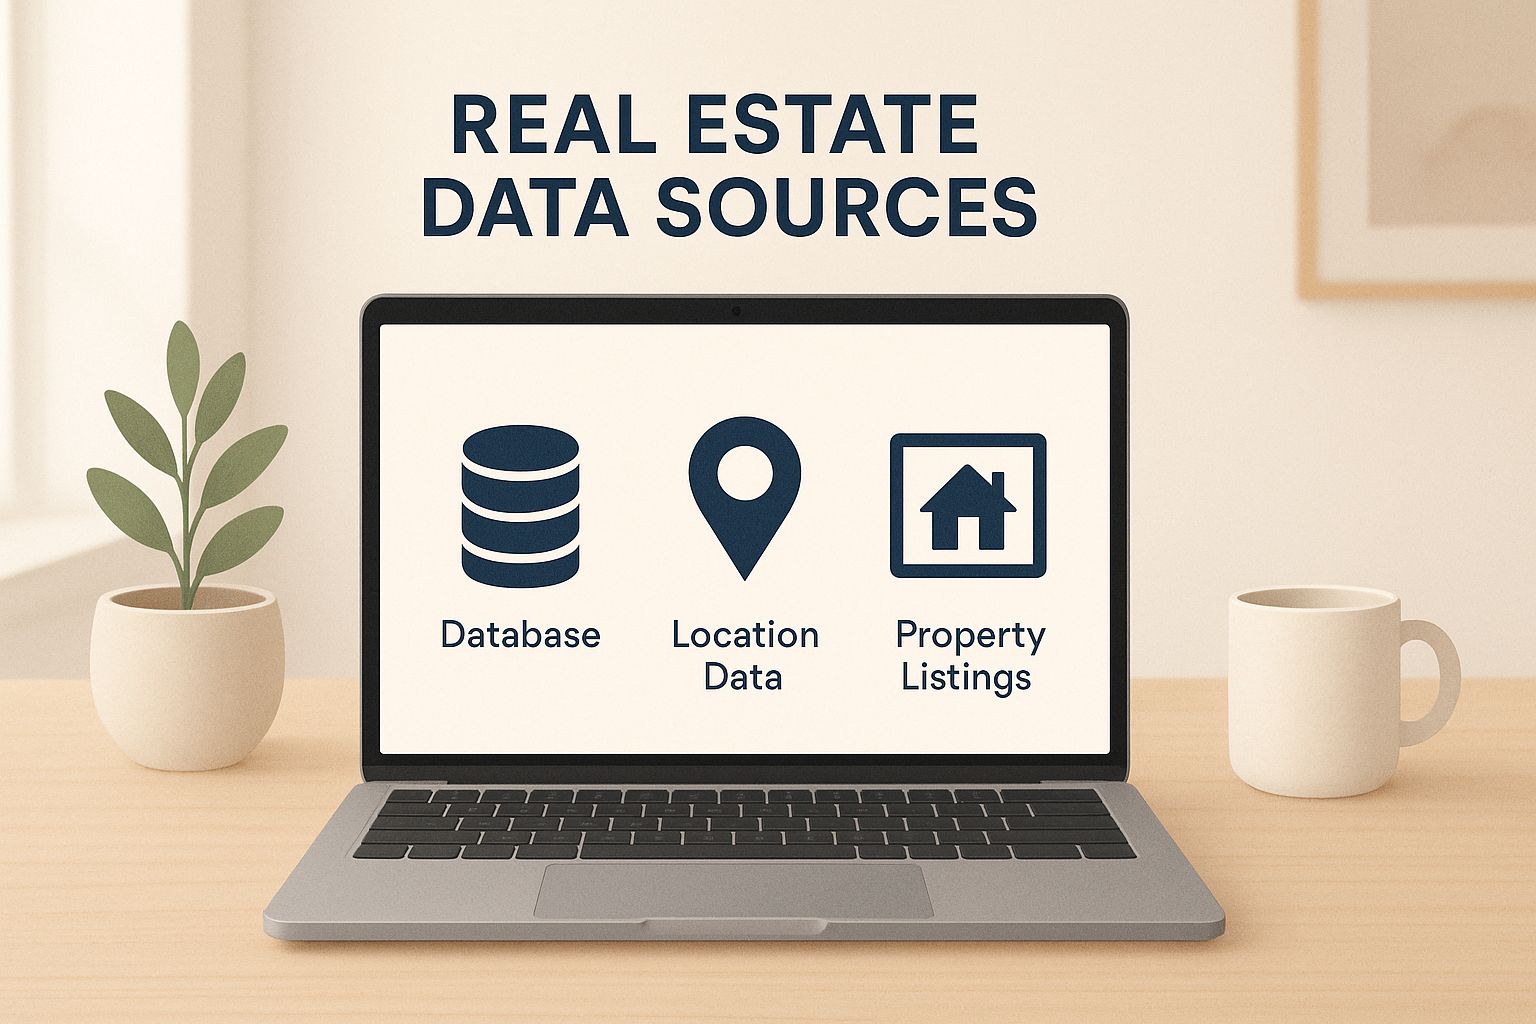
As you can see, the real magic happens when you start layering different data points—property details, market trends, neighborhood stats—to get a complete picture.
To really get it, let's break down how each type of analytics works and what it means for you on the ground.
Three Types of Real Estate Data Analytics
| Type of Analytics | Core Question It Answers | Real Estate Example |
|---|---|---|
| Descriptive | "What happened?" | Calculating the average Days on Market (DOM) for a neighborhood over the past six months. |
| Predictive | "What will likely happen next?" | Forecasting which zip codes are poised for the highest appreciation over the next 18 months. |
| Prescriptive | "What should we do about it?" | Recommending specific renovations that will generate the highest ROI for a property flip. |
Each of these levels gives you a progressively sharper edge, moving you from simply reacting to the market to actively shaping your outcomes within it.
H3: Descriptive Analytics: What Happened?
The whole journey starts with Descriptive Analytics. This is the foundation, and it’s all about looking backward to answer one simple question: "What has already happened?" It’s the process of gathering historical data and summarizing it to get a clear picture of past events.
For an investor, this is like checking the rearview mirror. It won't tell you what’s around the next bend, but it gives you critical context about the road you've just traveled.
Here are a few classic examples:
- Figuring out the average sales price for three-bedroom homes in a specific zip code over the last year.
- Tracking the average Days on Market (DOM) for homes in a target neighborhood to see how hot it is.
- Pinpointing which months historically have the highest number of property sales in your city.
This isn't flashy, but it's essential. It organizes market chaos into clear, understandable benchmarks.
H3: Predictive Analytics: What Will Happen?
Once you have a solid grasp on what happened, the natural next question is, "What's likely to happen next?" Welcome to the world of Predictive Analytics. This is where you take all that historical data and run it through statistical algorithms and machine learning models to forecast future trends.
Now, predictive analytics isn't a crystal ball—it deals in probabilities, not guarantees. Think of it as a highly sophisticated weather forecast for the real estate market. It helps you prepare for what’s coming by analyzing current patterns.
The industry is betting big on this. As of 2023, investment in PropTech hit around $630 million, and forecasts show the global AI-powered real estate market is expected to surge to $1,047 million by 2032. That’s a compound annual growth rate of about 11.52%.
H3: Prescriptive Analytics: What Should We Do?
This brings us to the final and most powerful level: Prescriptive Analytics. It goes way beyond just predicting an outcome. It actually recommends specific actions you should take to hit a target or dodge a potential risk. It answers the ultimate question for any investor: "Given what might happen, what should we do about it?"
This is where the data becomes your strategic partner. It combines insights from the first two levels to run simulations and chart the best path forward. It’s like a GPS that not only shows your destination (predictive) but actively calculates the best route, steering you around traffic jams and roadblocks in real-time.
Prescriptive analytics is the game-changer. It shifts you from being a passive observer of market trends to an active player who can influence outcomes with data-driven moves.
For instance, a prescriptive model could analyze market forecasts and your current portfolio to recommend the absolute best time to sell a property for maximum profit. Or it might suggest that adding a second bathroom will yield a far higher ROI than remodeling the kitchen.
You can find more real-world strategies and examples of this in action over on our Flip Smart blog. This is the pinnacle of using data analytics in real estate—turning numbers into decisions that drive serious success.
Key Metrics That Power Smart Property Investments

Moving from how data analysis works to what it actually tells you is where the magic happens. It's the point where theory turns into profit.
The real estate world is packed with jargon, but only a handful of key metrics truly form the bedrock of a sound investment decision. Learning these data points is like learning to read a property's vital signs—you can see its health, risks, and potential in clear, objective terms.
These aren't just numbers on a spreadsheet; they're stories. They tell you how quickly a market is moving, how much a property is really earning, and what kind of return you can expect on your hard-earned cash. Mastering them is essential for any investor looking to build a portfolio based on evidence, not emotion.
Foundational Property and Market Metrics
Before you can even think about profitability, you have to understand the property's baseline value and the market's temperature. These initial metrics provide the essential context for everything that follows. Think of them as the coordinates on a map—without them, you can't plot a course to your destination.
Two of the most fundamental indicators are Price per Square Foot and Days on Market (DOM).
Price per Square Foot: This is the ultimate equalizer. It levels the playing field, allowing you to compare properties of different sizes and layouts. A high price per square foot might point to a premium location or killer finishes, while a low number could signal a potential bargain... or a hidden problem. It’s the best apples-to-apples comparison tool in your kit.
Days on Market (DOM): This metric tells you one simple thing: how long has this property been sitting for sale? A low DOM screams high buyer demand and a hot market where homes get snapped up fast. A high DOM, on the other hand, could mean an overpriced listing, needed repairs, or a market that's starting to cool off.
Together, these local market indicators give you a powerful, at-a-glance snapshot of market health. This is where Multi-Listing Service (MLS) data becomes invaluable. Strategic use of MLS data, which includes both DOM and price per square foot, gives investors the crucial insights they need to position a property correctly.
This is a perfect example of how data analytics in real estate helps you stay ahead of trends, like the growing demand for energy-efficient homes. You can dive deeper into emerging market stats in this 2025 real estate market report.
Key Profitability and Return Metrics
Once you've got the market context down, it’s time to get to the good stuff: evaluating a property's financial performance. This is where you figure out if an investment actually lines up with your financial goals. These metrics cut through the noise to answer the most important question of all: "Will this property make me money?"
The two most critical profitability metrics are Capitalization Rate (Cap Rate) and Cash-on-Cash Return.
Capitalization Rate (Cap Rate) is arguably the most important metric for evaluating income-producing properties. It measures the property's unleveraged rate of return, giving you a quick way to compare potential investments regardless of financing.
The formula is simple: Net Operating Income (NOI) / Current Market Value. A higher cap rate generally points to a higher potential return, but it often comes with higher risk. For instance, a property with a 10% cap rate in an up-and-coming neighborhood might offer better returns than one with a 5% cap rate in a prime, stable area—but the risk profile is completely different.
While Cap Rate is fantastic for comparing different properties, Cash-on-Cash Return tells you what you're earning on the actual money you've pulled out of your pocket. It's calculated as: Annual Pre-Tax Cash Flow / Total Cash Invested. This metric is deeply personal because it accounts for your specific financing details.
Neighborhood and Qualitative Indicators
Finally, a truly sharp analysis looks beyond the property lines. The surrounding neighborhood has a massive impact on a property's long-term value and desirability. Data on things like school ratings, crime statistics, and local amenities provides a complete picture of an investment's future.
- School Ratings: Great school districts are a powerful engine for housing demand and can seriously boost property values.
- Crime Statistics: Low crime rates mean a higher quality of life, making a neighborhood way more attractive to potential buyers and tenants.
- Amenities: Being close to parks, public transit, cool shops, and good restaurants can make a location far more desirable and let you command higher prices or rents.
By weaving all these metrics into your analysis, you build a complete, 360-degree view of any investment opportunity. This data-driven approach is exactly how modern investors find and win deals. You can see a curated selection of properties analyzed this way by exploring our available Flip Smart properties.
Putting Real Estate Data Analytics Into Action
Understanding the theory is one thing, but seeing data analytics work in the real world is where its true power hits home. This is the point where abstract concepts like predictive modeling and market analysis transform into tangible, profit-driving strategies. By applying data, investors shift from making educated guesses to making precise, evidence-based decisions that can consistently outperform the market.
These applications aren't just reserved for massive investment firms. They are practical tools that individual investors can use today to gain a serious competitive edge. Let's dig into some of the most impactful ways data analytics is being put to work right now.
Automated Valuation Models (AVMs)
One of the most immediate applications is the use of Automated Valuation Models (AVMs). While a traditional appraisal might lean on a handful of comparable sales, AVMs process thousands of data points in seconds to deliver a highly accurate property valuation.
These models go way beyond basic comps. They chew through property features, historical sales data, tax records, market trends, and even hyper-local variables like school ratings and crime rates. For an investor, this means a fast, objective, and data-driven starting point for any negotiation or analysis, effectively stripping emotion out of the valuation process.
By looking at a property's value through the lens of data, an AVM can often spot discrepancies a human eye might miss, revealing if a property is truly undervalued or simply overpriced for its market.
This sheer speed and depth of analysis lets investors evaluate more deals in less time, dramatically boosting their chances of finding a winner before the competition even knows it's there.
Market Trend Analysis for Growth Areas
Perhaps the most exciting use of data analytics is pinpointing the next high-growth neighborhoods before they become common knowledge. Instead of chasing hot markets where prices are already peaking, savvy investors use data to find areas that are on the verge of a boom.
This involves looking at the leading indicators of growth, such as:
- Decreasing Days on Market (DOM): A steady drop in how long properties sit on the market is a classic sign that buyer demand is heating up faster than the available supply.
- Rising Rental Yields: When rents start climbing faster than property prices, it often signals a coming wave of buyer interest and a strong rental market.
- Public and Private Investment: Data on new infrastructure projects, commercial developments, or big company relocations can predict future job growth and, consequently, housing demand.
- Demographic Shifts: Tracking migration patterns and income growth helps identify areas that are attracting new residents with real purchasing power.
By layering these datasets, investors can essentially create a predictive map of a city's growth path, allowing them to get in early on areas with strong future appreciation potential.
Tenant Risk Assessment and Site Selection
The power of data analytics goes far beyond just buying properties. For rental property owners, it’s a critical tool for building stable, predictable cash flow. Tenant risk assessment models use historical rental data, credit information, and employment stability metrics to predict the likelihood of on-time rent payments. This helps landlords select reliable tenants and minimize the risk of costly evictions.
It's just as crucial in the commercial real estate world for site selection. A retail business, for example, can analyze demographic data, foot traffic patterns, and local consumer spending habits to find the absolute best location for a new store. It’s no surprise that a study by Deloitte found that over 72% of real estate firms are now using predictive analytics to identify investment opportunities and manage their portfolio risks.
The Advantage of Data-Driven Investing
The difference between old-school methods and a modern, data-backed approach is stark. Traditional investing often relies on gut feelings, limited local knowledge, and a small set of comps. A data-driven strategy, on the other hand, is built on a massive foundation of evidence.
Data-Driven Strategies vs. Traditional Methods
| Investment Task | Traditional Approach (Intuition-Based) | Data Analytics Approach (Evidence-Based) |
|---|---|---|
| Property Valuation | Relies on 3-5 comps and personal "feel." | AVMs analyze thousands of data points for an objective valuation. |
| Market Selection | Chases "hot" neighborhoods based on news or word-of-mouth. | Identifies emerging growth areas by tracking leading indicators. |
| Risk Assessment | Uses basic credit checks and landlord references. | Employs predictive models to score tenant default risk. |
| Deal Sourcing | Depends on MLS alerts and agent relationships. | Scans entire markets for undervalued properties meeting specific criteria. |
| Profit Projection | Estimates rehab costs and ARV based on experience. | Calculates ROI using real-time cost data and predictive ARV. |
This table makes it clear: while intuition is valuable, backing it up with hard data is what separates successful investors from the rest of the pack. It replaces guesswork with a systematic, repeatable process for finding and funding profitable deals.
How Flip Smart Puts Data to Work
Tools like Flip Smart are designed to make these powerful analytical methods accessible to every single investor. The platform is essentially a real-time analytics engine, applying these core principles to help you find undervalued properties and calculate potential returns with incredible precision.
Here’s a practical look at how it all comes together:
- Valuation and ARV: Flip Smart’s AVM instantly gives you an accurate current valuation and a data-backed After Repair Value (ARV).
- Cost Analysis: The system analyzes local labor and material costs to generate a detailed renovation budget, taking the guesswork out of rehab estimates.
- ROI Calculation: By stacking the total investment (purchase price + rehab costs) against the forecasted ARV, it calculates the potential profit and ROI for a flip.
This automated process boils down hours of manual research into a few seconds. You can explore how these features translate into different investment strategies by checking out the various Flip Smart pricing plans. This approach makes the power of data analytics tangible, showing investors exactly how to apply it to find and fund more profitable deals.
Using Predictive Analytics to Navigate Market Shifts

Real estate markets never sit still. They're constantly being pushed and pulled by economic swings, demographic trends, and whatever is happening with housing inventory. For an investor, trying to navigate these changes can feel like sailing in a thick fog.
Predictive analytics is the radar that cuts through that uncertainty. It’s designed to show you where the market is headed before it gets there.
This forward-looking approach to data analytics in real estate goes way beyond just looking at past sales. It uses sophisticated data models to forecast future conditions, turning market volatility from a scary threat into a clear strategic advantage. When you can read the signals, you can pivot with confidence and stay a step ahead of everyone else.
Forecasting with Economic and Demographic Data
At its heart, predictive analytics is about spotting the clues that change is coming. It’s a lot like how a meteorologist analyzes atmospheric pressure and wind patterns to predict a storm. Investors analyze data to predict where the market is going to move next.
So, what are these leading indicators? The models are fueled by a few key things:
- Economic Indicators: Data on interest rate trends, inflation, and local job growth are huge. They tell you a lot about buyer affordability and overall market confidence.
- Demographic Shifts: Keeping an eye on population migration, income growth in specific zip codes, and generational buying habits helps forecast where future housing demand will pop up.
- Inventory and Construction Levels: By tracking new construction permits and the current housing supply, you can spot potential future imbalances between how many homes are available and how many people want to buy them.
Putting all these variables together, predictive models can generate forecasts on everything from property appreciation rates in specific neighborhoods to bigger shifts in buyer sentiment. This is the kind of foresight that lets you act proactively, not reactively.
Differentiating Between New and Existing Inventory
A truly sharp analytical approach doesn't just look at total inventory. It digs deeper, understanding the critical difference between new construction supply and the availability of existing homes.
This distinction is crucial because each inventory type tells a different story about the market’s health—and offers totally unique opportunities.
Recent data paints this exact picture. While the number of new homes for sale shot up to 481,000 units (the highest since 2007), the supply of existing homes is still sitting 20-30% below previous market lows. This tells us that builders are scrambling to fill a gap left by a shortage of resale inventory, even as overall demand is sluggish with home price growth projected at 3% or less. You can get the full scoop on this complex housing outlook in this J.P. Morgan research.
This kind of nuanced insight is where the money is made. For example, if you know resale inventory is tight, targeting new builds or properties that appeal to buyers sick of bidding wars can be an incredibly effective strategy.
Turning Forecasts into Actionable Strategy
The whole point of predictive analytics is to inform decisive action. Knowing that a market is likely to cool down is interesting, but using that information to change your strategy is what actually grows your portfolio. A data-driven forecast empowers you to make confident pivots that protect your capital and boost your profits.
For instance, if predictive models forecast a slowdown in price appreciation alongside a jump in interest rates, a savvy investor might:
- Shift from Flipping to Renting: In a cooling market, securing a long-term rental provides stable cash flow while you wait for appreciation to pick back up.
- Target New Builds: When existing home inventory is low, new construction directly meets buyer demand, creating a clear opportunity for quicker sales.
- Adjust Offer Prices: Armed with data on future market softness, you can make more conservative offers on new acquisitions, seriously reducing your risk.
This ability to adapt is what separates the modern, data-driven investor from the rest. It’s how you navigate market shifts with precision, turning what feels like pure uncertainty into a calculated advantage.
Common Questions About Real Estate Data Analytics
Diving into data analytics can feel like learning a new language. You know it’s powerful, but the practical side of things can be intimidating. This is where the rubber meets the road.
We'll tackle the most common questions investors have when they start using data in their real estate business. The goal here is to cut through the noise and give you clear, straightforward answers so you can start making data-backed decisions with confidence.
What Tools Do I Need to Start?
You don't need a massive, expensive tech stack to get going. Honestly, many of the sharpest investors I know started out with what they already had: a powerful spreadsheet tool like Excel or Google Sheets and an MLS subscription. This is the perfect training ground for getting comfortable with the core concepts.
Once you’re ready to see the bigger picture and spot trends that a spreadsheet can’t easily show you, platforms like Tableau or Power BI are fantastic next steps. They turn raw numbers into compelling visual stories.
Key Takeaway: The best tool is the one you'll actually use. Start simple, master the key metrics, and then expand your toolkit as your skills and needs grow.
Of course, there are also specialized PropTech tools built specifically for real estate that do all the heavy lifting. These platforms are designed to automate the entire data collection and analysis process, handing you actionable insights on property values and market trends without a steep learning curve.
How Reliable Are Predictive Models?
This is a great question. The reliability of predictive models, like Automated Valuation Models (AVMs), really depends on their quality—but the best ones are incredibly accurate.
Top-tier AVMs get their precision by crunching thousands of data points at once. They look at property features, historical sales, neighborhood stats, and market trends in a way no human possibly could, leading to a highly objective valuation.
However, they aren't perfect. Their accuracy can dip when dealing with highly unique properties or in markets with very few recent comparable sales. A one-of-a-kind custom home is a lot harder for a model to price than a standard three-bedroom house in a big subdivision.
Think of an AVM as your data-driven starting point, not the final word. It provides an unbiased baseline that you can then build on. The smartest approach is to combine the model's insights with your own due diligence and, when needed, a professional appraisal. This hybrid method gives you the best of both worlds: the power of big data and the nuance of human expertise.
Can Data Analytics Find Off-Market Deals?
Yes, and this is where data analytics becomes a real game-changer. By systematically sifting through public records and other datasets, you can pinpoint properties with a high probability of selling soon—long before they ever hit the MLS.
It's all about building models to look for signs of a motivated seller. These indicators often include:
- Tax Delinquencies: Properties with overdue taxes are a classic sign of financial distress.
- Pre-Foreclosure Status: Owners who have just received a notice of default are often open to a direct offer.
- Long-Term Ownership: Someone who has owned a property for 30+ years may be ready to sell.
- Probate Filings: Properties tied up in an estate are frequently sold to settle affairs.
This data-driven prospecting lets you get in touch with owners directly, giving you a massive competitive edge. You get to negotiate without the pressure of a bidding war. It’s about creating your own opportunities instead of waiting for them to show up.
Is Data Analytics Only for Large Firms?
Not anymore. It’s true that big investment firms have entire data science teams, but the tools and data needed for powerful analysis have become way more accessible. The playing field has been leveled for individual investors and small teams.
A ton of valuable information is available from free public sources, like local census data and county property records. Even just doing a deeper dive into the data from your own MLS subscription can put you miles ahead of the competition.
For an individual investor, the goal isn't to build complex algorithms from scratch. It’s about using readily available data to gut-check your assumptions, find promising markets, and make smarter, evidence-based decisions. It’s about practical application, not theoretical data science—using data to answer your most important questions and de-risk every deal you do.
Ready to stop guessing and start analyzing? Flip Smart puts the power of data analytics at your fingertips, turning hours of research into seconds of insight. Analyze any property to uncover its true potential, from accurate valuations to detailed renovation costs and profit projections. Discover how Flip Smart can transform your investment strategy.