A house flipping spreadsheet is more than just a place to track numbers; it's your financial command center for every potential deal. It's a detailed, living document that goes way beyond rough estimates to map out everything from the purchase price and rehab costs to holding expenses and your final profit. Every decision you make should be backed by the data in this sheet.
Your Flip Succeeds or Fails in the Spreadsheet
Long before you swing a single hammer or sign any closing documents, the most critical work of a house flip happens inside a spreadsheet. This tool is the bedrock of every successful real estate investment. It’s what turns the old "buy low, sell high" mantra into a predictable, data-driven process.
This is where you stress-test your assumptions, uncover the hidden costs that quietly destroy profit margins, and make calculated decisions instead of emotional ones. Think of it as a complete financial model for your project. It forces you to account for every dollar, from the big-ticket rehab items down to the small, nagging fees that always add up. Without that clarity, you're just flying blind.
Moving Beyond Guesswork
Too many new investors get laser-focused on the purchase price and the exciting parts of the renovation. But the real profits are made—or lost—in the tiny details the spreadsheet forces you to confront.
Here are the pillars your analysis must be built on:
- After Repair Value (ARV): This is the projected sale price after you've completed all the work. It's the cornerstone of your entire calculation.
- Rehab Budget: A line-by-line breakdown of every material and labor cost, including a non-negotiable 10-15% contingency budget for the inevitable surprises.
- Holding Costs: These are the expenses that tick up every single day you own the property—loan payments, insurance, utilities, and property taxes.
- Selling Costs: The final hurdle. These are your realtor commissions, closing costs, and staging fees, which almost always land between 6-8% of the ARV.
These numbers don't work in isolation. They all interact to reveal whether a deal has real potential or is just a dud in disguise. If you neglect even one of these categories, a promising project can quickly turn into a financial nightmare.
To get started, it's helpful to see how these categories are organized.
Key Sections of Your Flip Analysis Spreadsheet
Here's a quick look at the essential data categories your spreadsheet needs for an accurate financial projection.
| Spreadsheet Section | What to Include | Why It Matters |
|---|---|---|
| Purchase & Financing | Purchase Price, Down Payment, Loan Amount, Interest Rate, Points | Determines your initial cash outlay and the cost of capital. |
| Rehab Budget | Itemized list of repairs (materials & labor), plus a 10-15% contingency. | This is the biggest variable cost; underestimating it is a classic mistake. |
| Holding & Operating Costs | Loan Payments, Insurance, Property Taxes, Utilities (monthly estimates). | These costs accumulate over time, making your project timeline critical. |
| Selling Costs | Realtor Commissions, Title Fees, Transfer Taxes, Staging, Closing Costs. | Often overlooked, these costs can take a 6-8% bite out of your final sale price. |
| Profit & ROI Metrics | Gross Profit, Net Profit, Return on Investment (ROI), Cash on Cash Return. | The bottom line. These metrics tell you if the deal is worth your time and risk. |
A well-structured sheet with these sections ensures you're not missing any critical financial pieces of the puzzle.
Navigating a Shifting Market
In a volatile real estate market, a detailed spreadsheet becomes even more essential. The house flipping market has seen some wild swings, peaking in 2022 with 407,417 properties flipped. Just a year later, that number dropped by 24% to 308,922 as higher mortgage rates squeezed profits and cooled buyer demand. You can find more data on how market shifts impact house flipping on Fairfigure.com.
This kind of volatility is exactly why you need precise financial analysis. Your spreadsheet helps you pinpoint your exact break-even point and model how different market scenarios could impact your profit margins.
A spreadsheet doesn't just calculate your potential profit; it reveals your project's vulnerabilities. It shows you exactly where a budget overrun or a timeline delay will hurt the most, allowing you to create contingency plans before you even make an offer.
At the end of the day, this isn't just about crunching numbers. It's about building a reliable financial model that protects your capital and guides every single move you make. A well-built flip house spreadsheet is what separates strategic investors from speculators.
Building Your Spreadsheet From the Ground Up
Okay, now that we've covered the basics, it's time to roll up our sleeves and build the actual tool. A truly powerful flip house spreadsheet starts with two absolute cornerstones: your purchase costs and your rehab budget. These two sections will dictate the majority of your upfront cash investment.
Getting these numbers right isn't just important—it's everything. This is where you graduate from ballpark estimates to a detailed, line-by-line financial roadmap. Every single cell and formula from here on out directly impacts the accuracy of your final profit numbers. Let's get it done.
Itemizing Your True Purchase Costs
The sale price is just the tip of the iceberg. I've seen countless new investors make the mistake of ignoring all the associated fees it takes to actually close the deal. These closing costs can easily tack on another 3-5% of the purchase price to what you need to bring to the table.
Your "Purchase Costs" section should be a simple but exhaustive list. All you need are two columns: one for the item description and one for its cost.
- Purchase Price: The number on the contract.
- Inspection Fees: This includes the general home inspection, pest, sewer scope, and anything else you need.
- Appraisal Fee: What you pay the lender to confirm the property's current value.
- Loan Origination Points: Fees the lender charges to create the loan. For hard money, this is often 1-2% of the total loan.
- Title Insurance & Escrow Fees: Covers a clean title search and the third-party company managing the closing.
- Recording Fees: The fee your county charges to officially record the deed transfer.
- Prepaid Property Taxes & Insurance: You'll almost always have to pay a prorated chunk of these upfront.
At the bottom of this list, create a "Total Purchase Costs" cell. A simple =SUM() formula to add up that column will do the trick. This final number is your real cost of acquisition, not just the sale price.
The flowchart below shows how these initial costs fit into the bigger picture of a flip.
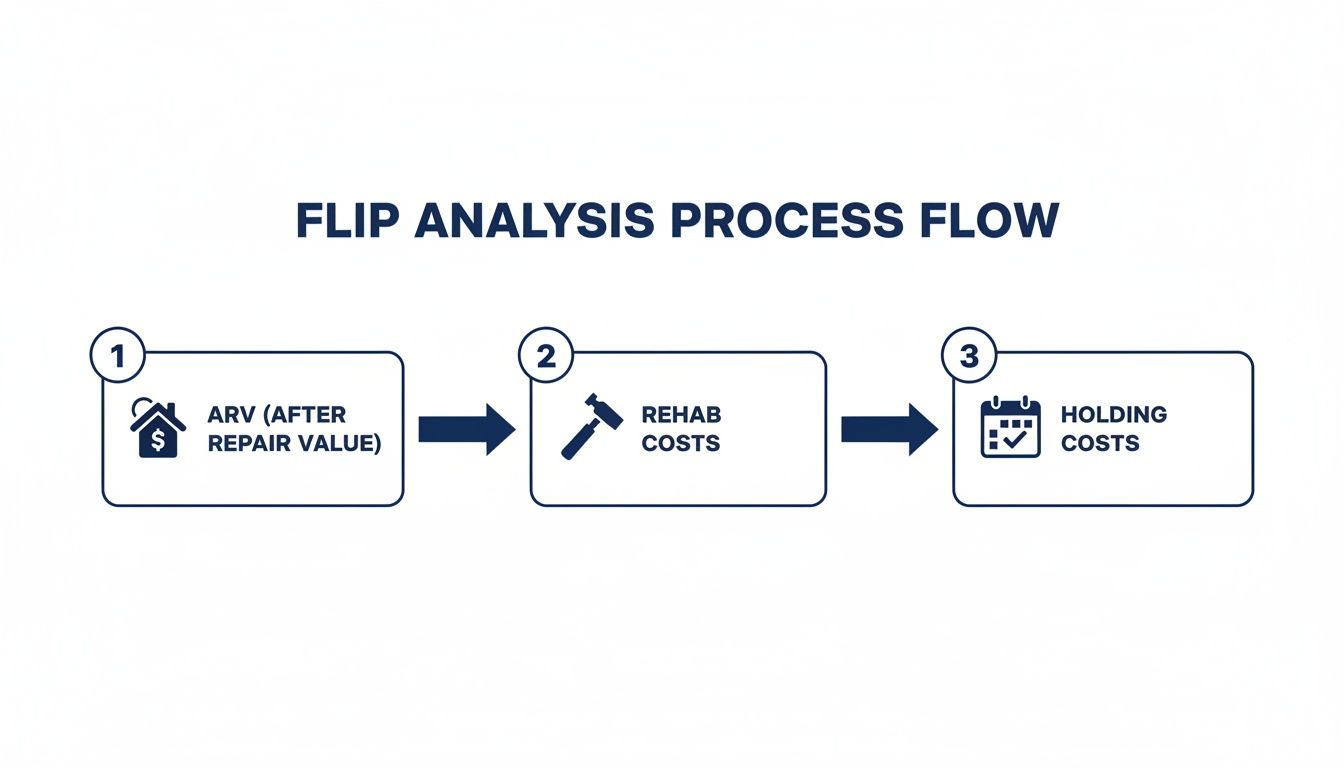
As you can see, a profitable flip is all about accurately connecting the future value (ARV) with the real-world costs of both the rehab and holding the property.
Structuring Your Rehab Budget
Of all the sections in your spreadsheet, the rehab budget is the most complex and has the most moving parts. A well-organized budget is your best defense against overspending and acts as a clear plan for the entire renovation. The best way I've found to tackle this is by breaking it down by area first, then by trade.
Start by creating logical categories for different parts of the property:
- Exterior (Roof, Siding, Paint, Landscaping)
- Kitchen (Cabinets, Countertops, Appliances, Flooring)
- Bathrooms (Vanity, Tile, Fixtures, Plumbing)
- General Interior (Drywall, Paint, Flooring, Lighting)
- Systems (HVAC, Electrical, Plumbing)
Under each of those categories, list out the individual line items. For instance, "Kitchen" would have separate lines for "Cabinetry," "Countertops," "Backsplash," etc. Each line item gets its own row with columns for "Budgeted Cost," "Actual Cost," and "Variance." This setup is crucial for tracking your spending in real time as the project moves forward.
A non-negotiable part of any rehab budget is a contingency fund. Always add a separate line item for 10-15% of your total estimated rehab cost. This isn't optional; it's for the surprises that will happen, like finding hidden water damage or an electrical panel that needs a full replacement.
A quick pro tip: if you're getting invoices or material lists from contractors as PDFs, learning how to extract tables from PDFs can save you hours of painful manual data entry and cut down on typos.
Once your budget is laid out, use =SUM() formulas to get subtotals for each category ("Total Kitchen Cost") and a grand total for the entire rehab. This detailed approach gives you complete command over your spending and sets you up for an accurate profit analysis later. To see how these pieces connect in a more advanced model, you can check out a complete real estate investment analysis spreadsheet.
Don't Let Hidden Costs Kill Your Profit
Your profit on a flip isn't made when you sell—it's protected long before that. The biggest threat? The slow, steady drip of costs you rack up just by owning the property.
While the rehab budget gets all the glory, holding and selling costs are the silent killers of a deal. This is where your flip house spreadsheet becomes your first line of defense, shielding your bottom line from the daily expenses that pile up whether you’re swinging a hammer or not.
So many investors make the same critical mistake: they get tunnel vision on the renovation and completely underestimate these "soft costs." They forget about the months of loan payments, insurance premiums, and utility bills that stack up while the house is a construction zone. Trusting a mental estimate here gives you a dangerously rosy financial picture and can lead to a nasty shock at the closing table.
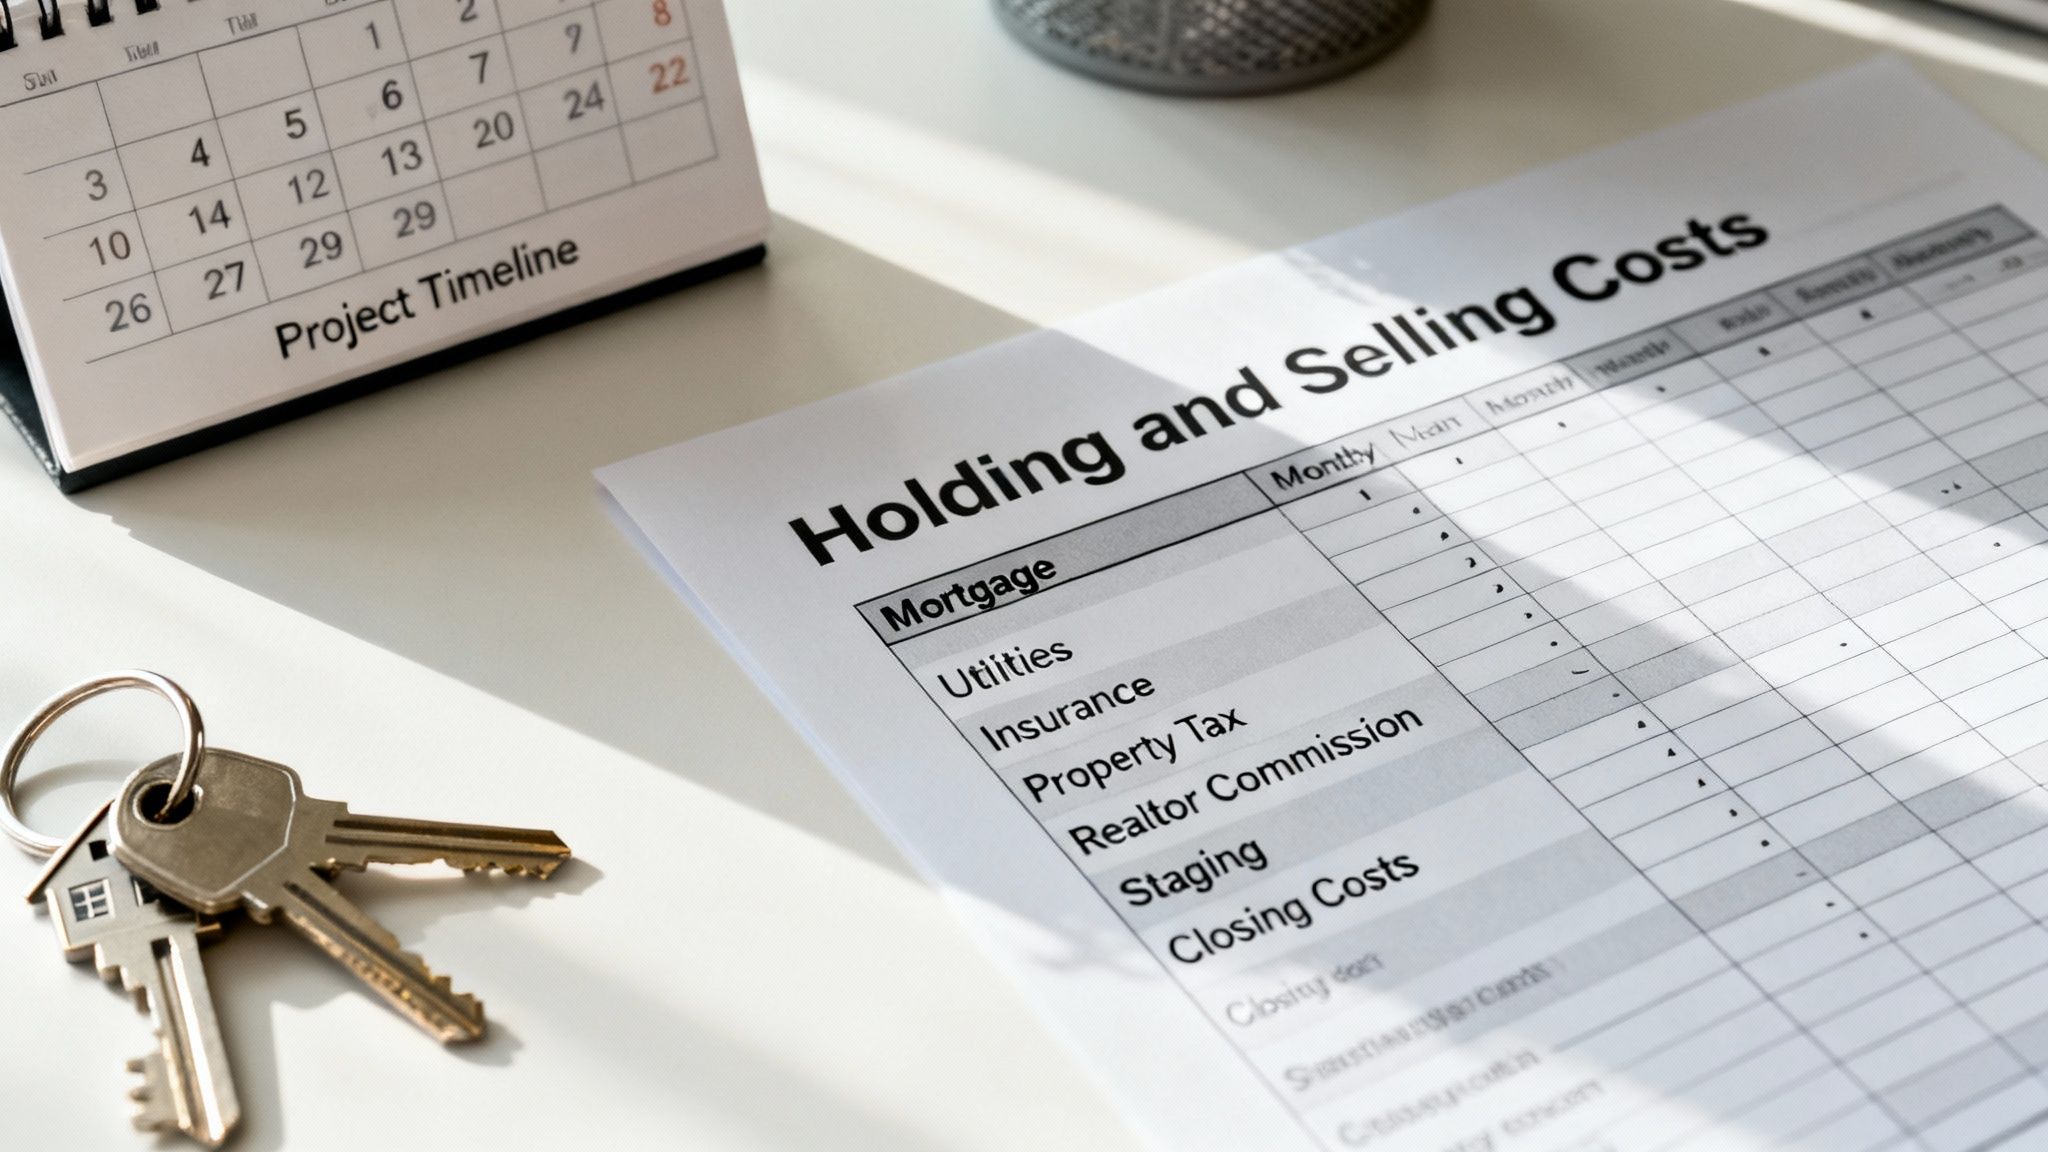
Dialing in Your Monthly Holding Costs
Holding costs are every recurring expense you pay while the property is in your name. Every single day your project runs over schedule, these costs are eating directly into your profit margin. Your spreadsheet needs a dedicated section to track these based on your projected timeline.
Get started by creating a simple table for your monthly burn rate. It has to include these essentials:
- Loan Payments (PITI): Your Principal, Interest, Taxes, and Insurance. For most flippers, this is the biggest single holding cost.
- Utilities: Don't forget electricity, water, gas, and trash. Even an empty house needs power for saws and water for cleanup.
- Property Taxes: Break down the annual tax bill into a monthly figure.
- Insurance: You'll need a vacant property or builder's risk policy, which is often pricier than standard homeowner's insurance.
- HOA Fees: If there's a homeowners association, these monthly dues are non-negotiable.
The formula is simple but powerful: multiply each monthly cost by your projected holding period. If your total monthly nut is $1,500 and you plan for a six-month project, you must budget $9,000 for holding costs. To really nail this down, our guide on how to calculate holding costs dives deeper into the specifics.
Accounting for Every Single Selling Expense
Once the last paintbrush is cleaned, you're still not done spending money. The costs to actually sell the property are the final hurdle, and they can easily skim 6-8% or more right off the top of your sale price. If you calculate your profit based on the ARV alone, you're setting yourself up for disappointment.
Your "Selling Costs" section needs to be just as detailed as your rehab budget. Here’s what mine always includes:
- Realtor Commissions: Budget for 5-6% of the sale price. This is typically split between the buyer's agent and your listing agent.
- Seller Concessions: It's common for buyers to ask for credits toward their closing costs or for small repairs found during inspection. I always budget 1-2% here as a buffer.
- Staging Fees: Professional staging can help a house sell faster and for more money. Marketing strategies have real costs, and it pays to understand your options. A good virtual staging vs. traditional staging cost analysis can help you decide what's right for your budget and market.
- Closing Costs: This is a catch-all for title insurance, escrow fees, transfer taxes, and attorney fees. Expect these to run another 1-2% of the sale price.
By subtracting your total selling costs from the final sale price, you arrive at your Net Sales Price. This is the true top-line number you'll be working with when you calculate your final profit, not the ARV.
Meticulously tracking these often-overlooked costs transforms your spreadsheet from a rough guess into a serious tool for financial planning. It’s the difference between hoping for a profit and actually planning for one.
The Profit Formulas Every Flipper Must Know
Once you've plugged in all your costs, it’s time for the moment of truth. This is where your spreadsheet transforms from a simple cost tracker into a powerful deal-making machine. The formulas you build here are what tell you if a deal is good, great, or one you should sprint away from.
These calculations aren’t just for a post-mortem after you’ve sold the house. You should be running these numbers constantly, from your very first look at a property all the way to closing day. Think of them as the vital signs of your flip’s financial health.
Gross Profit vs Net Profit
Let’s quickly clear up two terms that new investors often confuse, but have very different impacts on your bank account: Gross Profit and Net Profit.
Gross Profit is the back-of-the-napkin number. It’s simply your After Repair Value (ARV) minus the purchase price and rehab costs. This gives you a quick, high-level snapshot of a deal's potential before all the other pesky costs creep in.
But Net Profit? That’s the number that really matters. This is your actual take-home cash after every single expense—purchase, rehab, holding, and closing costs—has been paid. It’s the true measure of a successful flip.
Essential Profit Metrics and Their Formulas
To truly understand a deal's potential, you need to look beyond a simple profit number. The following metrics are the core of any professional flip analysis, giving you a complete picture of your investment's performance.
| Metric | Spreadsheet Formula | What It Tells You |
|---|---|---|
| Gross Profit | = (ARV - Purchase Price - Rehab Costs) | A high-level view of profit before holding and selling costs. |
| Net Profit | = (ARV - All Costs) | Your true take-home profit after every single expense is paid. |
| Return on Investment (ROI) | = (Net Profit / Total Cash Invested) * 100 | Measures the efficiency of your total capital deployed in the project. |
| Cash-on-Cash Return | = (Net Profit / Actual Cash Out of Pocket) * 100 | Shows the return specifically on your own invested cash, ignoring financed amounts. |
These formulas are the heart of your analysis spreadsheet. For a deeper dive into the numbers that drive smart real estate deals, check out our detailed guide on essential real estate math formulas. Getting comfortable with these calculations is non-negotiable for serious investors.
ROI vs Cash-on-Cash Return What’s the Difference
This is a critical distinction that trips up a lot of new investors. While both ROI and Cash-on-Cash Return measure profitability, they answer slightly different—but equally important—questions.
Return on Investment (ROI) looks at the performance of all the money in the deal, whether it came from your pocket or a lender's. It answers the question: "How efficiently did the total capital perform?"
Cash-on-Cash Return (CoC), on the other hand, is laser-focused on the return generated by your personal, out-of-pocket cash. If you used a hard money loan and only put $50,000 of your own money into the deal, CoC tells you the return on that specific $50,000. It answers the question: "How hard did my personal cash work for me?"
For any flipper using leverage (loans), Cash-on-Cash is often the more insightful metric. It perfectly illustrates the power of using other people's money to generate outsized returns on your own capital.
A Quick Litmus Test The 70% Rule
Before you spend hours diving deep into a full analysis, you need a quick way to filter out the duds. That's where a classic rule of thumb comes in: the 70% Rule.
This guideline says you should never pay more than 70% of a property's After Repair Value (ARV), minus the estimated repair costs. It’s a conservative filter designed to build a healthy profit margin into your deal right from the start.
The 70% Rule Formula:
Maximum Allowable Offer (MAO) = (ARV x 0.70) - Estimated Rehab Costs
Plugging this formula directly into your spreadsheet gives you an instant "go/no-go" signal. If the seller’s asking price is way above your calculated MAO, you immediately know you’ll need to negotiate aggressively or just walk away.
It's also crucial to understand how market trends impact these numbers. Investment returns are shifting toward more affordable markets where lower entry costs can lead to higher profit margins. A metric called the "Flip Factor," which measures how much a renovation boosts a home's value, shows huge regional differences. For instance, Pittsburgh leads the nation with a Flip Factor of 58.2%, meaning renovations there add over 58% to a property's value. You can discover more insights about these market shifts on ScotsmanGuide.com.
By building these profit formulas and benchmarks into your flip house spreadsheet, you’re doing more than just accounting. You’re creating a predictive tool that can forecast outcomes, spot strong opportunities, and ultimately, protect your capital.
Stress-Testing Your Deal with Scenario Analysis
A good spreadsheet tells you one outcome; a great one prepares you for many. After you’ve built out all the cost and profit sections, the final layer of a professional flip house spreadsheet is adding the ability to stress-test your assumptions. Real estate investing is full of variables, and I've seen too many investors get burned by relying on a single, best-case scenario. It's a recipe for disaster.
This is where scenario analysis, sometimes called sensitivity analysis, comes into play. It’s simply the process of modeling how your bottom line changes when key variables shift. What happens if the market cools and your After Repair Value (ARV) comes in 5% lower than you hoped? What if a surprise plumbing issue pushes your renovation 20% over budget? Or what if the property sits on the market for an extra 60 days, racking up holding costs?

By preparing for these possibilities right inside your spreadsheet, you can understand the true risk profile of any deal and make smarter decisions. You’ll know your exact break-even points and can walk into a project with your eyes wide open, fully prepared for the inevitable bumps in the road.
Creating Your Dynamic Input Cells
The first thing you need to do is isolate the most impactful and unpredictable variables in your flip. Instead of hard-coding these numbers directly into your formulas (a common mistake), you’ll create a dedicated "Scenario Inputs" section, usually right at the top of your sheet for easy access.
This section will house the core assumptions that drive your entire financial model. From my experience, the three most critical variables to include are:
- Projected ARV: The estimated final sale price of the property.
- Rehab Budget: The total cost of all renovations.
- Holding Period (in months): The total time from purchase to sale.
Each of these gets its own cell. Now for the crucial part: you need to go back through your spreadsheet and link all relevant formulas to these new input cells. For example, your holding cost calculation should now multiply your monthly expenses by the value in your "Holding Period" input cell, not a fixed number like "6". This simple change makes your entire model dynamic.
Running Best-Case and Worst-Case Scenarios
With your dynamic inputs in place, you can now instantly model different outcomes. I like to create a simple table to run and display at least three core scenarios: Most Likely, Worst Case, and Best Case. This gives you a clear, immediate range of potential outcomes for any deal you're analyzing.
Let's see this in action with a real-world example:
| Scenario | ARV Adjustment | Rehab Budget Adjustment | Holding Period Adjustment | Resulting Net Profit |
|---|---|---|---|---|
| Most Likely | 0% | 0% | 0% | $55,000 |
| Worst Case | -10% | +20% | +3 Months | $8,500 |
| Best Case | +5% | -10% | -1 Month | $78,000 |
To run the "Worst Case" scenario, you would just go to your input cells and manually decrease the ARV by 10%, increase the rehab budget by 20%, and add three months to the holding period. Because your entire spreadsheet is linked to these inputs, your net profit and ROI cells will update instantly, showing you the new, less-rosy outcome.
Running these scenarios does more than just show you numbers; it reveals a deal's resilience. If a project's profit gets completely wiped out by a small 5% drop in ARV, it may be too fragile to pursue. A strong deal, however, will still show a reasonable profit even under moderately negative conditions.
This level of analysis is what separates seasoned investors from amateurs. It shifts your mindset from simply hoping for the best to being fully prepared for reality. Building this functionality into your flip house spreadsheet empowers you to evaluate risk with clarity and confidence, ensuring you only move forward on deals with a robust financial foundation. The small amount of time it takes to set this up is one of the highest-return activities you can perform.
Frequently Asked Questions About Flip Spreadsheets
What's the biggest mistake new investors make on their spreadsheet?
Hands down, the most common error is underestimating or completely forgetting about holding and selling costs. New flippers often focus only on the purchase price and rehab budget, then get a nasty surprise when loan payments, insurance, utilities, and realtor commissions eat up 6-8% (or more) of their profit at the end. A thorough spreadsheet forces you to account for every penny.
How accurate do my rehab cost estimates need to be?
Your initial estimates should be as accurate as possible, but they will never be perfect. Get multiple quotes from licensed contractors for major jobs (roof, HVAC). For finishes, visit a hardware store to price out materials per square foot. Most importantly, always include a contingency line item of 10-20% of your total rehab budget. This isn't "if" money; it's "when" money for the inevitable surprises.
Can I use a template instead of building my own spreadsheet?
Yes, using a pre-built template is a great starting point. It can introduce you to cost categories and formulas you might have overlooked. However, the true learning comes from customizing it or building your own. Understanding the logic behind the calculations gives you the power to analyze unique deals and adapt to changing market conditions. Think of a template as training wheels—helpful at first, but you'll eventually want the control of building your own.
Ready to move beyond manual spreadsheets? Flip Smart automates the entire analysis process, giving you ARV, rehab estimates, and profit projections in seconds. Stop guessing and start making data-driven decisions. Analyze your next deal for free.