A Discounted Cash Flow (DCF) model is one of the most powerful tools for any buyer looking to understand an investment's true worth. At its heart, it’s a method for figuring out what a property is worth today based on the cash it’s expected to generate in the future.
The model works by projecting all the future cash an asset will generate and then "discounting" those future dollars back to what they're worth today. This process helps you look past market hype and speculation to find the property's intrinsic value, giving you a solid number to guide your offer.
Why DCF is a Go-To Valuation Tool in Real Estate
When you need to get serious about a property's value, you have to look beyond simple comparisons or gut feelings. That's where a Discounted Cash Flow analysis comes in. It’s a foundational tool because it forces you to value a property based on the one thing that truly matters: the cash it produces.
The entire model hinges on a core financial truth—the time value of money. A dollar in your pocket today is worth more than a dollar you'll get next year because you can invest it and earn a return. A DCF model simply puts numbers to that concept, helping you make smarter, data-driven buying decisions.
Core Components of a DCF Model
Building a discounted cash flow model in Excel might sound intimidating, but it really boils down to three key parts.
- Projecting Future Cash Flows: This is where you forecast the net cash a property will generate over a specific period, usually 5-10 years. Think of this as estimating your future rental income minus expenses.
- Picking a Discount Rate: This rate, often called the Weighted Average Cost of Capital (WACC), is your reality check. It reflects the risk tied to the investment—a riskier property requires a higher discount rate.
- Calculating a Terminal Value: A property doesn't just stop producing cash after year 10. This is your estimate of the property's value beyond your initial forecast, capturing its long-term potential.
To understand why this model carries so much weight, exploring the overall value of a business valuation helps put its importance into perspective.
Excel remains the best tool for this kind of analysis for one simple reason: flexibility. It lets you tweak assumptions—like rent growth or future repair costs—and instantly see the impact on your valuation. This makes it easy to run different scenarios (best-case, worst-case, and most likely) to understand the full spectrum of potential outcomes.
While DCF is a powerful tool, it's just one piece of the puzzle. It's always smart to see how it stacks up against other real estate valuation methods.
A Quick Look at the Numbers: The DCF model isn't just an academic exercise; it's the industry standard. A 2022 survey found that over 78% of finance professionals across North America and Europe rely on Excel-based DCF models for their primary valuation and investment decisions. It’s the tool the pros use to make billion-dollar calls.
Before we dive into building the model, let's get a high-level view of the key components you'll be working with in your spreadsheet.
Table: Core Components of a DCF Model
This table gives you a quick-reference guide to the essential inputs and outputs we’re about to build in our Excel model. Think of it as your roadmap for the steps ahead.
| Component | Purpose in the Model | Key Excel Functions to Use |
|---|---|---|
| Cash Flow Projections | Forecasts the annual net operating income (NOI) and unlevered free cash flow (UFCF) over 5-10 years. | SUM, IF, Basic arithmetic (+, -, *, /) |
| Discount Rate (WACC) | Calculates the rate used to discount future cash flows back to their present value, reflecting investment risk. | AVERAGE, SUMPRODUCT |
| Terminal Value | Estimates the property's value at the end of the projection period, using either the Gordon Growth or Exit Multiple method. | (Cash Flow * (1 + g)) / (r - g) formula |
| Present Value (PV) | Calculates what each future cash flow is worth today by applying the discount rate. | NPV, XNPV |
| Valuation Summary | Aggregates the present values of all cash flows and the terminal value to arrive at the intrinsic value. | SUM |
| Sensitivity Analysis | Creates data tables to show how the final valuation changes based on shifts in key assumptions (e.g., discount rate, growth). | Data Table (under What-If Analysis) |
Having this structure in mind will make the process of building each section in Excel much clearer and more organized. Let's get started.
Structuring Your DCF Spreadsheet for Success
Before you even think about complex formulas, the success of your discounted cash flow model hinges on a clean, logical structure. A well-organized spreadsheet is your single best defense against frustrating errors and confusing data.
Think of it like building a house. You have to get the foundation and framing right before you start picking out paint colors. Get this part right, and everything else becomes infinitely simpler.
The professional standard is a modular approach. Instead of cramming everything into one massive worksheet, we're going to create separate, dedicated tabs for each core component of the model.
The Four Essential Tabs of a DCF Model
Your Excel workbook should be divided into at least four primary tabs. This simple separation makes your model easier to build, audit, and explain to others—whether that’s a partner, a lender, or just yourself six months from now.
- Assumptions Tab: This is your command center. All the key drivers of your model—rent growth rates, vacancy assumptions, tax rates, capital expenditures (CapEx), and the discount rate—live right here. By centralizing these inputs, you can change a core assumption in one place and watch the entire model update instantly.
- Financials Tab: This tab holds your historical data (if you have it) and your projected income statement, balance sheet, and cash flow statement. The formulas here will link directly back to your Assumptions tab.
- DCF Calc Tab: Here’s where the magic happens. This sheet pulls the projected cash flows from your Financials tab and runs the actual discounting calculations to arrive at the Net Present Value (NPV).
- Sensitivity Tab: No valuation is complete without stress-testing your assumptions. This is where you’ll build data tables and charts to see how your valuation changes when key variables (like the growth rate or WACC) move up or down.
This setup isn't just for show; it's how you maintain control and clarity as the model gets more complex.
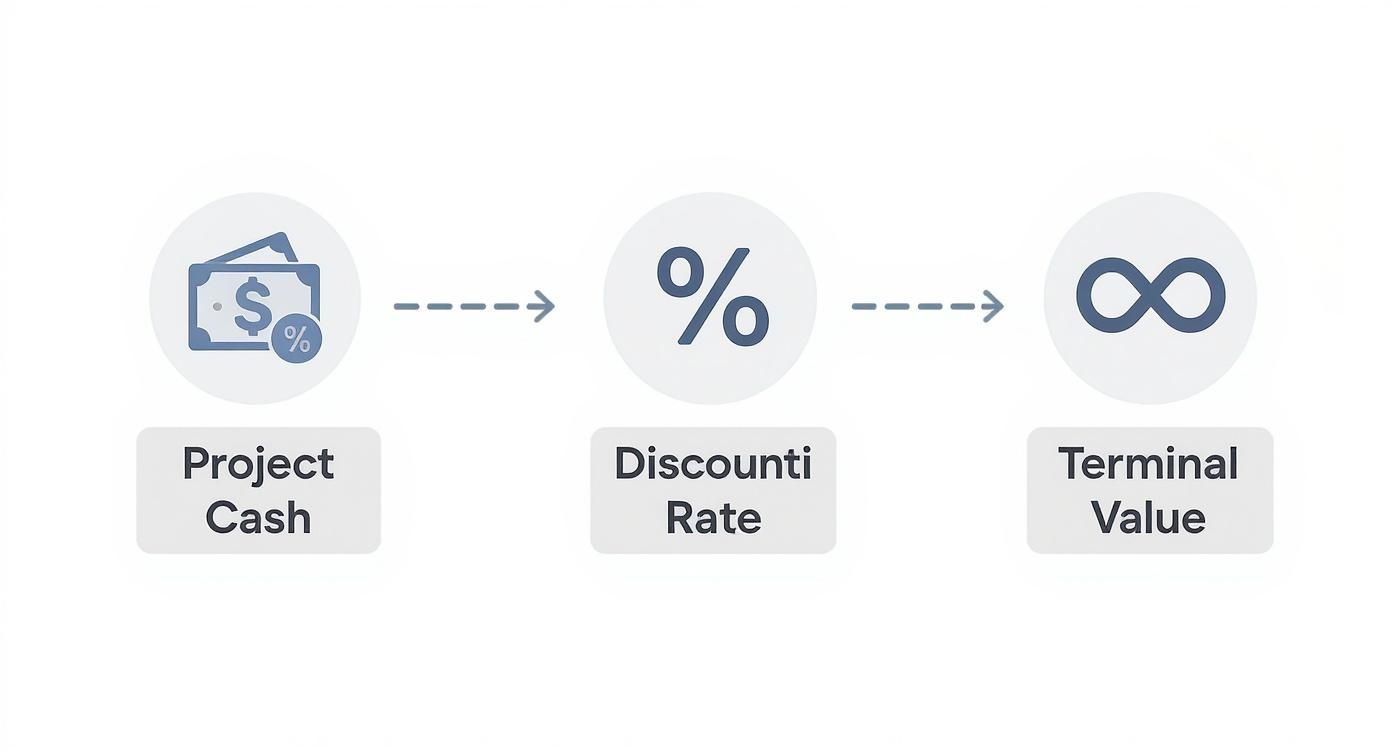
As the flow shows, projecting your cash flows, nailing down a discount rate, and calculating a terminal value are the sequential steps that lead to a final, defensible valuation.
Best Practices for a Clean Layout
Beyond just using separate tabs, a few simple formatting habits can dramatically improve your model’s clarity. The most important is color-coding your cells. It’s a simple visual cue that instantly tells anyone looking at your model what's a hard-coded input versus a calculated formula.
Pro Tip: Use blue font for input cells (hard-coded numbers you type in, like a 5% growth rate) and black font for formula cells (calculations that pull from other cells). This is a non-negotiable best practice in professional financial modeling.
When setting up your forecast, lay out your timeline horizontally across the top, typically for a 5-10 year period. Label your rows clearly down the side, starting with revenue and working your way down to free cash flow. Mastering this structure is a valuable skill in itself.
For investors looking to apply these principles specifically to property analysis, our guide on building a real estate investment analysis spreadsheet provides a practical, property-focused template.
The demand for these skills has skyrocketed. Enrollment in online financial modeling courses focusing on Excel and DCF analysis grew by 67% between 2018 and 2022, with over 1.2 million learners completing them in 2022 alone. It's clear this is a skillset that pays dividends.
How to Forecast Unlevered Free Cash Flow
Alright, this is where the magic happens. Your discounted cash flow model in excel starts to feel real once you begin forecasting Unlevered Free Cash Flow (UFCF). This is the engine that drives your entire valuation. We’re moving from setup to the core calculation—figuring out the raw cash the property generates before any financing comes into the picture.
Think of UFCF as the pure, operational cash flow available to everyone with a stake in the deal—both you (the equity) and the bank (the debt). It gives us a clean, unfiltered look at the property's earning power, which is exactly what we need for a solid valuation.
From Revenue to NOPAT
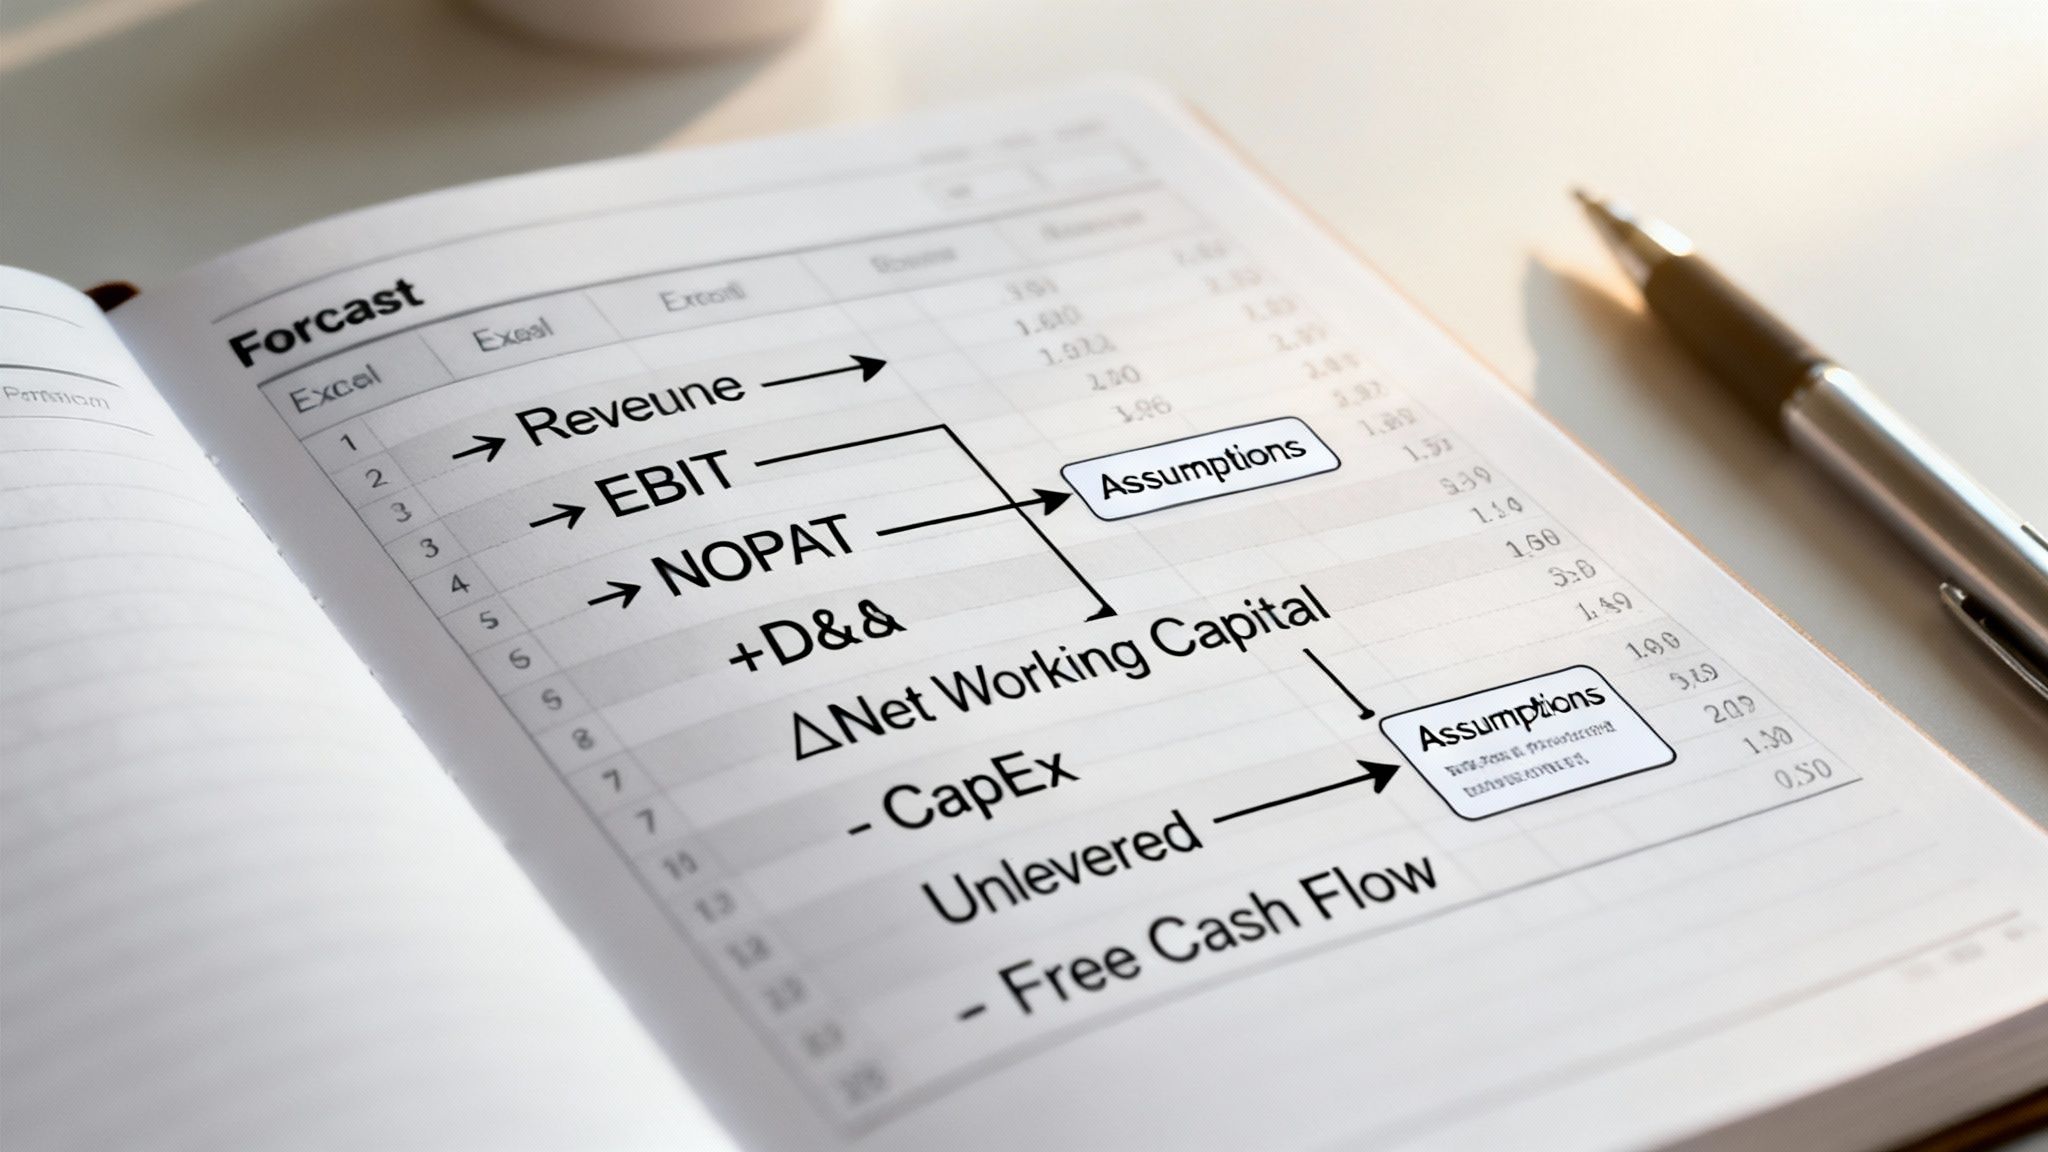
Everything flows from the top line. A believable revenue forecast isn't just a straight line extended from the past. You have to consider things like local rental market growth, your property's competitive position, and the broader economic climate. Once you have a defensible revenue forecast for your 5-10 year holding period, you can work your way down to Net Operating Profit After Tax (NOPAT).
Here’s a simple breakdown of the calculation:
- Revenue: Project your total rental income and any other revenue for each year. This needs to be driven by your 'Assumptions' tab. For example, a formula might look like
='Assumptions'!B5*(1+'Assumptions'!B6). - Operating Expenses (OpEx): Forecast your operating costs (like property taxes, insurance, and maintenance) as a percentage of revenue, again linking back to your assumptions sheet. Subtracting these from revenue gives you your Earnings Before Interest and Taxes (EBIT), or in real estate terms, your Net Operating Income (NOI).
- Taxes on EBIT: Now, calculate the tax expense based on your operating profit. This is a critical step: Do not subtract interest expense first. We're looking at the tax liability as if the property had no debt. The formula is simple:
=EBIT * Tax_Rate. - Calculate NOPAT: From there, it's just NOPAT = EBIT - Taxes on EBIT. This is your starting point for building out the actual free cash flow.
NOPAT is a powerful metric. It shows what the property would earn, after taxes, if it were owned free and clear.
Adjusting for Non-Cash Items and Investments
Now we have to turn that "profit" number into actual cash. This is where many models get tripped up, but it's pretty straightforward if you follow the logic. We need to add back expenses that didn't actually cost us cash (like depreciation) and subtract cash we spent on big-ticket investments (like a new roof).
Add Back Depreciation & Amortization (D&A)
Depreciation is a paper expense that lowers your taxable income without requiring you to write a check. Since we subtracted it to get to our EBIT, we have to add it back to NOPAT to get a truer picture of cash flow.
=NOPAT + D&A
This simple adjustment gets us one step closer to real cash profit.
Account for Changes in Net Working Capital
Net Working Capital (NWC) is basically your operational short-term assets minus your short-term liabilities. As a rental business grows, you might need more cash on hand for security deposits or pre-paid expenses. This investment ties up cash, so an increase in NWC is a cash outflow that we need to subtract.
Key Takeaway: An increase in Net Working Capital is a use of cash, which reduces your UFCF. A decrease in Net Working Capital is a source of cash, which increases it.
In Excel, you’d calculate the change from the previous year, like this:=-(Current_Year_NWC - Prior_Year_NWC)
Subtract Capital Expenditures (CapEx)
Finally, the big one. We have to subtract any cash spent on Capital Expenditures. This is the money you spend on major upgrades and replacements—things like a new roof, HVAC system, or parking lot resurfacing. It's a very real cash outflow that isn't fully captured on the income statement as a period expense.
Making these adjustments gets us to our final Unlevered Free Cash Flow. Truly understanding how these pieces fit together is crucial for any buyer. For a deeper look tailored to real estate, check out our guide on cash flow for real estate.
The complete UFCF formula in your Excel cell will look something like this:
UFCF = NOPAT + D&A - Change in NWC - CapEx
By linking every single input back to your 'Assumptions' tab, you build a dynamic, powerful model. If you change your rent growth assumption from 5% to 6%, your UFCF for every single year will update instantly. That's the power of a professional-grade discounted cash flow model in excel.
Nailing Down the Discount Rate and Terminal Value
So you’ve forecasted your Unlevered Free Cash Flows. That's a huge step, but those future dollars are worth less than a dollar today. To figure out their present value, you need a discount rate.
This isn't just a random number; it's arguably the most critical—and most debated—input in your entire discounted cash flow model in excel. A brilliant forecast paired with the wrong discount rate can give you a dangerously misleading valuation.
The gold standard for a discount rate is the Weighted Average Cost of Capital (WACC). Think of it as the blended cost of all the money—both debt and equity—used to fund the property. It represents the minimum return the investment must generate to keep both lenders and equity partners happy.
Breaking Down the WACC Calculation
Calculating WACC might look a bit intimidating at first glance, but it's just a few logical pieces put together. We're essentially figuring out the cost of equity and the cost of debt, then weighting them based on how the deal is structured.
Here’s what you need to pull it all together:
- Cost of Equity (Re): This is the return shareholders (you and your partners) expect for taking on the risk of investing. The go-to formula is the Capital Asset Pricing Model (CAPM): Re = Risk-Free Rate + Beta * (Market Risk Premium).
- Cost of Debt (Rd): This is simply the effective interest rate you're paying on your loan. A key detail here is to make it an after-tax number, since mortgage interest is a tax-deductible expense.
- Capital Structure Weights (E/V and D/V): This is just the percentage of the total project cost that's funded by equity (E) versus debt (D). For example, a deal with 25% down would have a 25% weight for equity and 75% for debt.
A Word of Caution: The discount rate is where many models fall apart. A 2019 study highlighted that the average error in DCF valuations was a staggering 18% compared to actual market prices. For properties with volatile cash flows, that error jumped to 25%. Small tweaks here have a massive impact, so it pays to be thoughtful. You can read the full research about these DCF findings to see just how sensitive your model is to this assumption.
Capturing the Long-Term Value (Terminal Value)
Your detailed cash flow projections won't run forever—most models stop at 5 or 10 years. But a good property is expected to keep generating value long after that. That's where the Terminal Value (TV) comes in. It’s a single number that captures the value of all cash flows from the end of your forecast into perpetuity.
There are two solid methods for calculating this.
1. The Gordon Growth Model (GGM)
This is the most common route. It assumes the property's cash flow will grow at a steady, constant rate forever. You just take the cash flow from your final projected year, grow it by one more period, and divide that by the discount rate minus your long-term growth rate.
- Formula:
TV = (Final Year UFCF * (1 + g)) / (WACC - g) - Key Assumption: The perpetual growth rate (g) needs to be conservative. A safe bet is to keep it at or below the long-term inflation or GDP growth rate, typically in the 2-3% range.
2. The Exit Multiple Method
This approach is more direct: it assumes you sell the property at the end of the forecast period. You take a metric from the final year (like Net Operating Income) and apply a market-based capitalization rate (cap rate) or multiple. It’s grounded in real-world transaction data but can be swayed by short-term market sentiment.
- Formula:
TV = Final Year NOI / Exit Cap Rate - Key Consideration: Your exit cap rate should be based on what similar properties are trading for. Be realistic—it's often wise to assume a slightly higher cap rate than the one you bought at to build in a margin of safety.
Which one is better? For a stable, mature asset like a multifamily building in a core market, the Gordon Growth Model often works well. For a property in a more dynamic or cyclical market, or one you genuinely plan to sell, the Exit Multiple method can feel more tangible. Smart analysts often calculate Terminal Value using both methods to check their work.
Alright, you’ve done the heavy lifting. Your cash flows are projected, and you've nailed down your discount rate and terminal value. Now it’s time to bring it all home.
This is where all that detailed work in your discounted cash flow model in excel pays off, culminating in a clear, defensible valuation. We're about to translate those future cash flows into a real number that tells you what the property is worth today.
First, we'll calculate the Enterprise Value (EV), which is the total value of the asset itself. Then, we’ll build a quick bridge from that number to the Equity Value—the slice of the pie that actually belongs to you, the investor.
Discounting Cash Flows to Find Enterprise Value
The first move is to calculate the present value (PV) of each projected Unlevered Free Cash Flow (UFCF) and the Terminal Value you just figured out. This is where Excel’s NPV function really shines.
Here's a common trip-up: the NPV function in Excel is designed to calculate the Present Value of a stream of cash flows starting from period one. To use it correctly, you need to lump your Terminal Value in with the final year's cash flow.
In your 'DCF Calc' tab, your setup should look something like this:
- Year 5 UFCF: Let’s say this is $50,000.
- Terminal Value: Calculated at $1,000,000.
- Total Year 5 Cash Flow: Combine these in a single cell for the final period: $1,050,000.
- Use the NPV Function: Your formula will point to your WACC (we'll use 8%) and the full range of your unlevered cash flows. The formula would look like
=NPV(8%, C5:G5), where that range includes years 1 through 4, plus the combined total for year 5.
The result is the property's Enterprise Value (EV). This number represents the total worth of the real estate asset, completely independent of how it’s financed.
Building the Bridge from EV to Equity Value
Enterprise Value is a great metric, but as a buyer, what you really care about is the Equity Value. This is the value left for you after all debt has been paid off. Getting from EV to Equity Value requires a simple but critical "bridge."
The calculation is straightforward:
Equity Value = Enterprise Value - Total Debt + Cash & Cash Equivalents
You subtract debt because lenders have first claim on the property's assets. You add back any cash on hand because it’s a non-operating asset that, while not part of the core property value, ultimately belongs to the equity holders.
Why Add Back Cash? Think of it this way: Enterprise Value reflects the value generated by the property's operations. The cash sitting in a reserve account isn't part of that operational engine. If you were to buy the property, you’d acquire that cash, which effectively lowers your net purchase price.
Once you have the Equity Value, you're at the finish line. This number represents the ultimate output of your DCF model—a target value for your portion of the investment based on fundamental analysis.
To pull all of this together, you'll rely on a handful of powerful Excel functions. They do the heavy lifting for you, ensuring your calculations for present value and investment returns are spot on.
Essential Excel Functions for DCF Valuation
Here's a quick reference table of the key functions you'll use in this final stage of the valuation.
| Excel Function | What It Does for You | Where to Use It in the Model |
|---|---|---|
NPV | Calculates the present value of future cash flows. | Used to discount your UFCF and Terminal Value back to today's date |
IRR | Finds the discount rate that makes NPV equal zero. | Used to calculate the project's internal rate of return. |
XNPV | Calculates NPV for cash flows on specific dates. | Useful for models with irregular or non-annual cash flow timing. |
XIRR | Calculates IRR for cash flows on specific dates. | The more precise version of IRR for real-world project timelines. |
These functions are the workhorses of any financial model. Getting comfortable with them will make your analysis faster, more accurate, and much easier to troubleshoot.
Running Sensitivity and Scenario Analysis
Let’s be honest: a single valuation number looks precise, but it's almost always wrong. The real power of your discounted cash flow model in excel isn't in spitting out one number; it's in stress-testing your assumptions. This is where you move from a single, fragile estimate to a dynamic range of possibilities, giving you a much clearer picture of the risks and rewards.
Your valuation is only as good as the inputs you feed it. Running sensitivity and scenario analyses helps you understand which of those inputs really matter. It answers the most important question for any deal: "What has to go right for this to work?"
Using Data Tables for Sensitivity Analysis
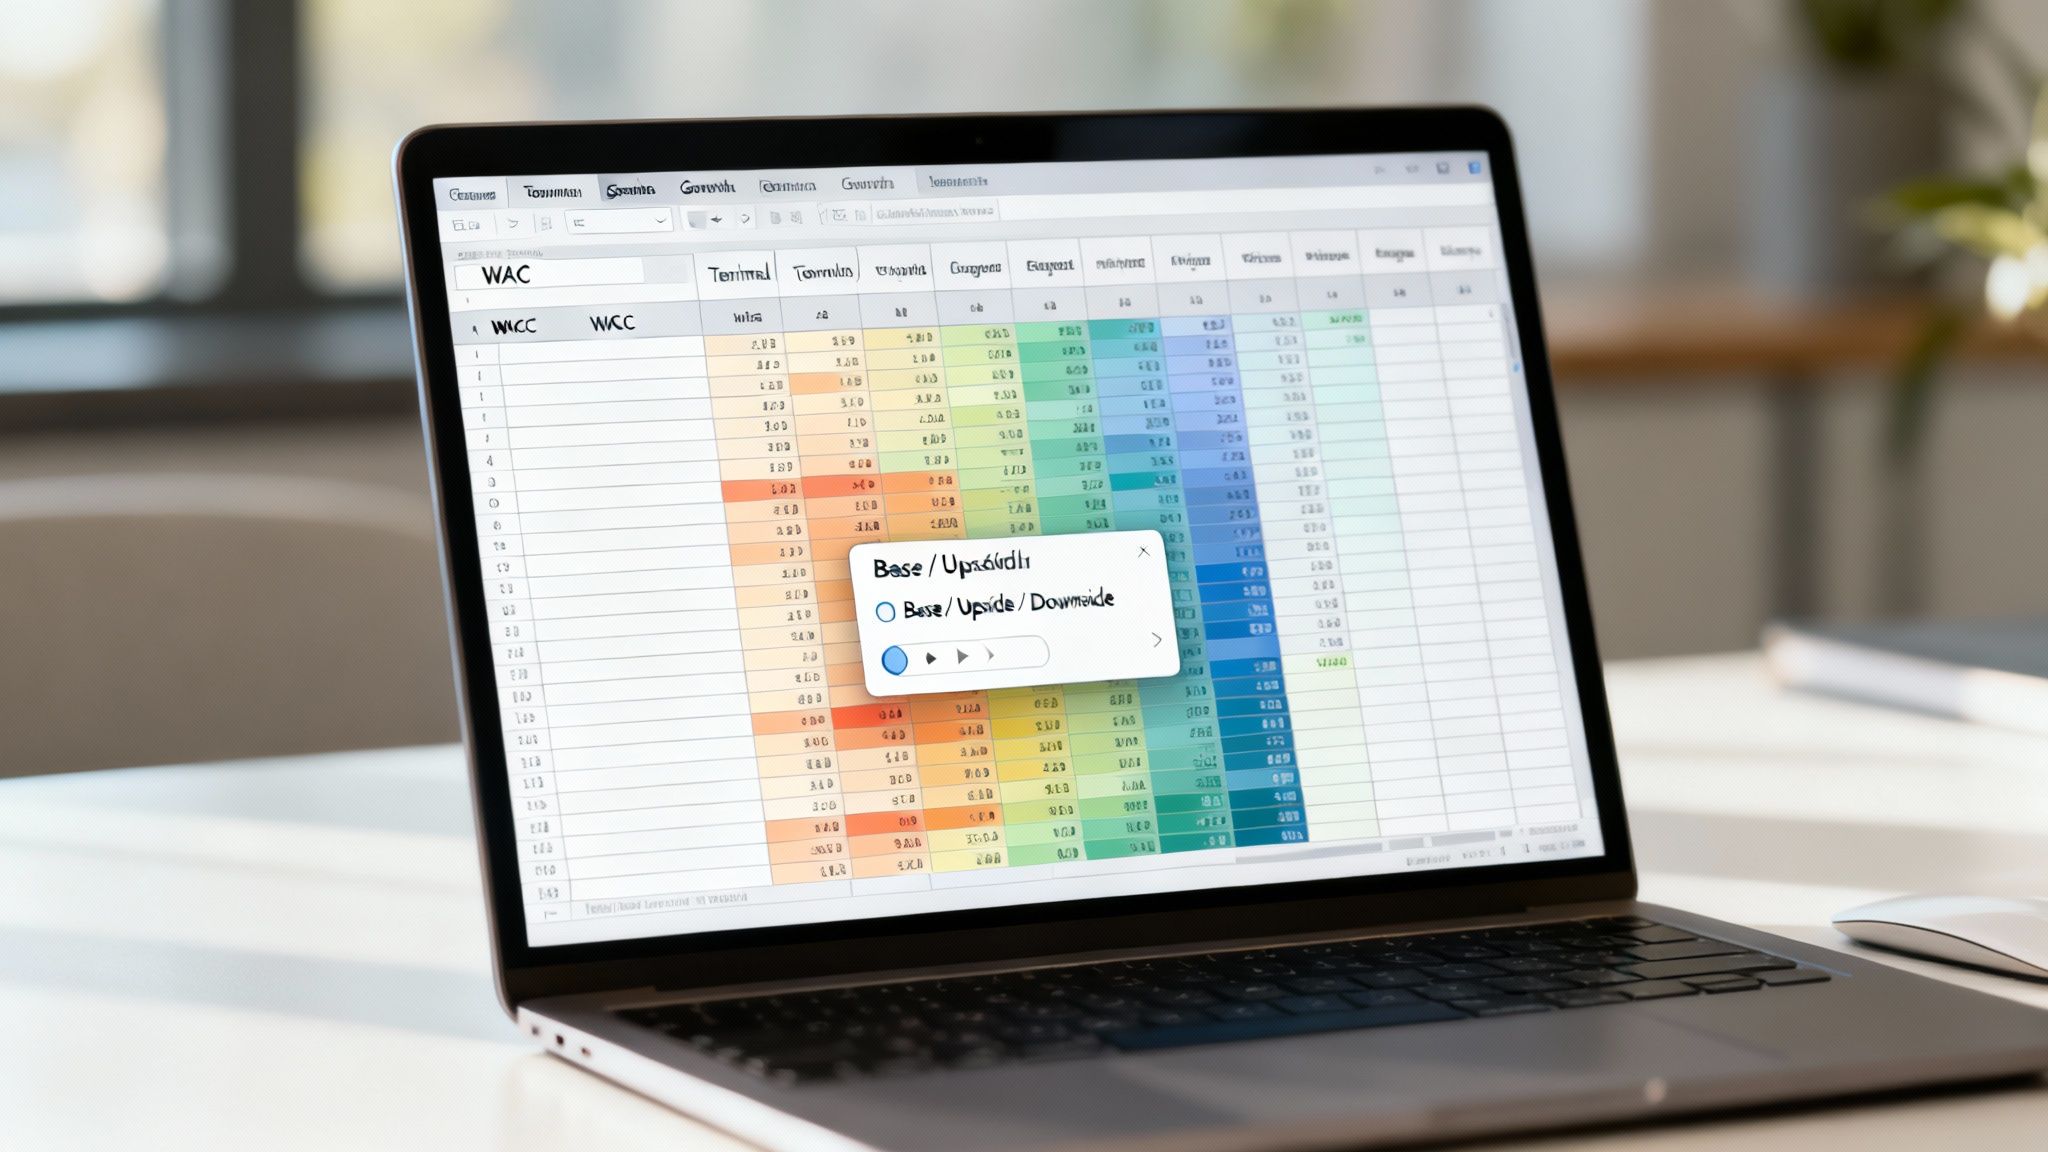
Excel's built-in Data Table feature is a fantastic tool for this kind of pressure test. It lets you see exactly how your final valuation shifts when two key variables move at the same time. For most real estate DCF models, the most common drivers to test are your discount rate (WACC) and your perpetual growth rate. Even tiny tweaks here can cause massive swings in your final number.
Setting this up is pretty straightforward. You’ll want to create a grid, typically in a dedicated 'Sensitivity' tab.
- List a range of WACC assumptions down the first column.
- Then, list a range of terminal growth rate assumptions across the top row.
- In the top-left corner cell where the row and column meet, link directly to your final valuation output (like your total NPV or Equity Value).
- Finally, just highlight the entire table and use the Data Table tool (you'll find it under the "What-If Analysis" menu).
Excel does the heavy lifting, instantly filling the grid to show you the valuation at every intersection of your two variables. This matrix gives you a powerful visual of the investment's risk profile right at your fingertips.
Building Scenarios for a Realistic Range
While data tables are great for isolating two variables, a full scenario analysis gives you a more holistic, real-world view. Instead of just tweaking one or two numbers in a vacuum, you change a whole set of assumptions to reflect different potential futures.
Pro Tip: Don't just pull random numbers out of thin air for your scenarios. Your 'Upside' case should be based on plausible positive events (e.g., higher-than-expected rent growth, lower vacancy rates), and your 'Downside' case should reflect realistic challenges (e.g., an economic slowdown, unexpected major repairs).
The cleanest way to build this is with a simple toggle on your 'Assumptions' tab. Create a dropdown menu with your three cases: Base, Upside, and Downside. From there, you can use IF or CHOOSE functions to make your key assumptions—like revenue growth, operating margins, or CapEx—automatically switch based on the selected scenario.
This approach transforms your static model into a dynamic decision-making tool. It gives you a realistic range of outcomes instead of a single, misleading point estimate. For real estate investors, platforms like Flip Smart can seriously accelerate this process by providing validated market data to build more reliable and accurate scenarios right from the start.
Frequently Asked Questions for Home Buyers
Here are answers to a few common questions that come up when you're deep in a valuation for a potential home or investment property.
How long should I forecast cash flows for a residential property?
For most home buyers, a 5 to 10-year forecast is ideal. This timeframe is long enough to model different scenarios like potential rent increases or the cost of a major repair (like a new roof in year 7), but short enough that your assumptions remain realistic. A 5-year forecast works well for stable neighborhoods, while a 10-year outlook is better if you anticipate significant changes or are buying in a developing area.
What’s the biggest mistake a new buyer can make with this model?
The most common mistake is being too optimistic. It's easy to assume rents will always go up and that major repairs won't be needed. A good model forces you to be realistic. Always build a "worst-case" scenario where vacancy is higher than expected or a major appliance breaks. This helps you understand the true risk and ensures you aren't overpaying based on a best-case-only fantasy.
Can I use a DCF model to decide if renting is better than buying?
Absolutely. You can build one model for the "buy" scenario, forecasting your mortgage payments (as a negative cash flow), property taxes, maintenance, and the eventual sale price (as your Terminal Value). Then, build a simpler "rent" model showing only your rental payments. By comparing the Net Present Value of both scenarios, you can get a data-driven answer on which path is financially better for you over a specific period.
How can I estimate future repair costs (CapEx) for my model?
Estimating future Capital Expenditures (CapEx) can be tricky. A good rule of thumb for general maintenance is to budget 1-2% of the property's value annually. For major items, get specific. During your inspection, ask the inspector about the remaining lifespan of the roof, HVAC system, and water heater. If the roof has 5 years left, you can budget for its replacement cost in Year 6 of your model. This turns a vague fear into a calculated expense.
Ready to stop building models from scratch and start analyzing deals in seconds? Flip Smart provides instant, data-driven valuations, rehab estimates, and profit projections for any property. Make faster, smarter investment decisions today. Learn more at Flip Smart.