When you're looking at potential rental properties, you need a quick way to compare one deal to another. How can you tell if a property is a good investment without getting lost in complicated spreadsheets? That's where the cap rate comes in.
Don't let the name intimidate you. Calculating the capitalization rate, or "cap rate," is surprisingly simple. You just divide the property's Net Operating Income (NOI) by its purchase price. This one number gives you a clean, apples-to-apples metric to size up different investment opportunities. Think of it as a quick financial health check for a building.
What Cap Rate Reveals About a Rental Property
Before we start crunching numbers, let's get clear on what the cap rate really tells you. In simple terms, it’s one of the most important numbers in real estate for measuring a property's potential yearly return. It looks purely at the income a property generates relative to its price.
The formula is straightforward: Cap Rate = Net Operating Income (NOI) / Property Value.
You'll notice this calculation intentionally leaves out your mortgage. Why? Because it focuses on the property's performance, not your personal loan details. This gives you an unbiased look at its raw earning power, letting you compare a duplex in one part of town to a small apartment building across the city on a level playing field.
Cap rate is a critical first look at a property's profitability and a true cornerstone of any serious real estate financial analysis.
Why This Single Number Matters So Much
A cap rate isn't just financial jargon; it’s a practical tool for making smarter investment decisions. Here’s what it helps you do:
- Compare Opportunities Quickly: It’s the fastest way to stack up multiple properties to see which ones offer a better potential return on your money.
- Gauge the Market: Looking at the average cap rates in an area gives you a feel for what other investors are thinking. Lower cap rates usually mean higher demand and less perceived risk. Higher cap rates might signal a riskier deal or a less popular market.
- Evaluate Risk vs. Reward: Generally, a higher cap rate can point to a riskier investment with a bigger potential payoff. On the other hand, a lower cap rate often signals a safer, more stable property with lower—but more predictable—returns.
Understanding Market Dynamics and Cap Rates
Cap rates aren't set in stone; they move with the market. For instance, in the early 2000s, it wasn't uncommon to see high-quality properties trading in the 8–10% cap rate range. By the 2010s, a flood of investment money pushed those same cap rates down into the mid-single digits.
This trend, known as “cap-rate compression,” sent property values soaring and shows just how sensitive real estate prices are to this one metric.
How to Calculate Your Net Operating Income Accurately
Getting your Net Operating Income (NOI) right is the most important part of calculating a reliable cap rate. Think of NOI as the property's pure profit before you account for your loan or income taxes. It's the engine of your investment, and a small error here can throw your whole analysis off.
Calculating NOI involves two main steps: figuring out your real income and then subtracting all the costs of running the property. Let's walk through exactly how to do this so your final number is one you can trust.
This process flow shows how a correctly calculated NOI feeds into the cap rate, which in turn reveals a property's income potential, its market value, and its overall financial health.
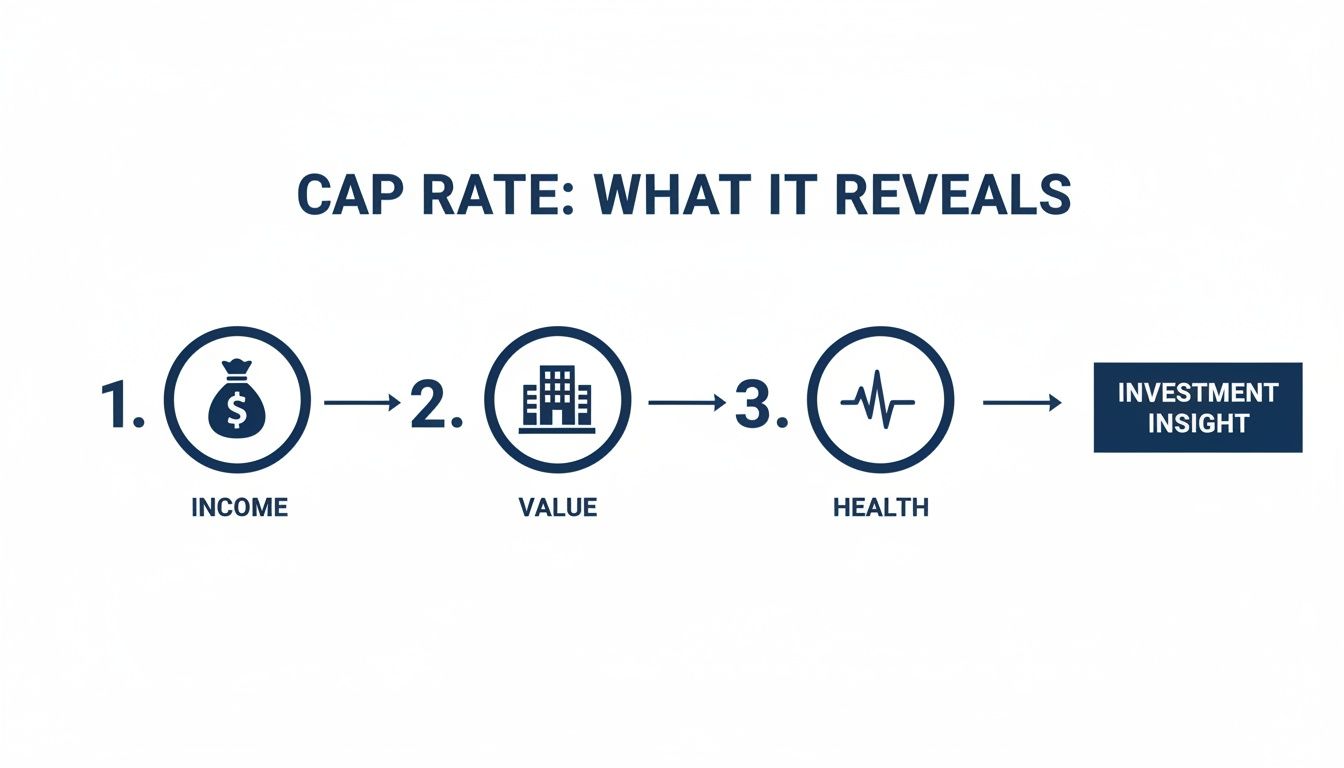
The visualization breaks down how this single metric provides a clear line of sight from raw income to a property's overall investment quality.
Start With All Potential Income Streams
Your first step is to add up every dollar the property could possibly generate in a year. This is called Gross Potential Income (GPI). For most rental properties, the main source is, of course, the rent.
But don't stop there. Many properties have other ways of making money that you should include for an accurate picture.
Consider these additional income sources:
- Parking Fees: Do you charge tenants for assigned parking spots or garages?
- Laundry Facilities: Coin-operated washers and dryers can add a surprising amount to your monthly income.
- Storage Units: If the property has extra storage lockers, they can be rented out for a monthly fee.
- Pet Fees: Many landlords charge a one-time fee or monthly "pet rent."
- Late Fees: While you hope not to collect them, late payment penalties are a potential source of income.
Gathering all this information gives you the maximum theoretical income your property can produce.
Find Your Effective Gross Income
Now, it's time to be realistic. It’s rare for a property to be 100% occupied with every tenant paying on time, all year long. That's why the next step is to adjust your Gross Potential Income for vacancies and missed rent payments. This new, more realistic figure is your Effective Gross Income (EGI).
To calculate this, you'll subtract an allowance for two key things:
- Vacancy Loss: This is the income you lose when a unit is empty between tenants. A common rule of thumb is to use a vacancy rate of 5-8%, but this can vary a lot based on your local market's demand.
- Credit Loss: This accounts for tenants who don't pay their rent. Unfortunately, it happens, and you need to budget for it.
Practical Tip: Don't just guess your vacancy rate. Research the average vacancy rate for similar properties in your specific neighborhood. A local property manager or real estate agent who works with investors is a great source for this data.
By subtracting these potential losses from your GPI, you arrive at your Effective Gross Income—a much more accurate reflection of the money you can actually expect to collect.
Tally Up Your Operating Expenses
With your realistic income figured out, it’s time to subtract the costs of keeping the property running. These are your Operating Expenses. It's crucial to be thorough here; missing even one expense can make a property seem more profitable than it really is.
Your list of operating expenses should include everything required to maintain the property and serve its tenants. A solid list will always cover these essentials:
- Property Taxes: This is usually one of the largest expenses. You can find this on the current owner's tax bill or public records.
- Insurance: You'll need landlord or property insurance to cover liability and damage.
- Property Management Fees: Even if you plan to manage it yourself, it's wise to include this fee (typically 8-10% of EGI). It represents the value of your time and makes your analysis comparable to professionally managed properties.
- Repairs and Maintenance: This covers everything from a leaky faucet to patching drywall. A good starting point is budgeting 5-10% of your EGI.
- Utilities: Include any utilities you, the owner, are responsible for, such as water, sewer, trash, or electricity for common areas.
- Landscaping and Snow Removal: Keeping the property looking good is a recurring cost.
A key step in determining your Net Operating Income is understanding how to calculate rental income correctly, as this forms the basis of your property's gross revenue.
What Not to Include in Operating Expenses
This is where many new investors make a critical mistake. To keep the NOI calculation pure, there are several costs you must exclude. Remember, NOI measures the property's performance, not your personal financial situation.
Do NOT include these items in your operating expenses:
- Mortgage Payments: Your loan principal and interest are financing costs, not operating costs.
- Capital Expenditures (CapEx): These are major upgrades that extend the life of the property, like a new roof or HVAC system. These are treated separately from routine maintenance.
- Income Taxes: Your personal income tax is not related to the property's operational performance.
- Depreciation: This is a non-cash expense used for tax purposes and doesn't affect your day-to-day cash flow.
By leaving these out, you ensure your NOI is an "apples-to-apples" number you can use to compare any property, regardless of how it’s financed.
Once you subtract your total Operating Expenses from your Effective Gross Income, you have your Net Operating Income. This is the final number you'll use in the cap rate formula, and now you can be confident it's built on a solid, realistic foundation.
A Real-World Example of Calculating Cap Rate
Theory is great, but let's walk through a real-world scenario to see how it works. Seeing how the numbers flow makes the whole concept much clearer.
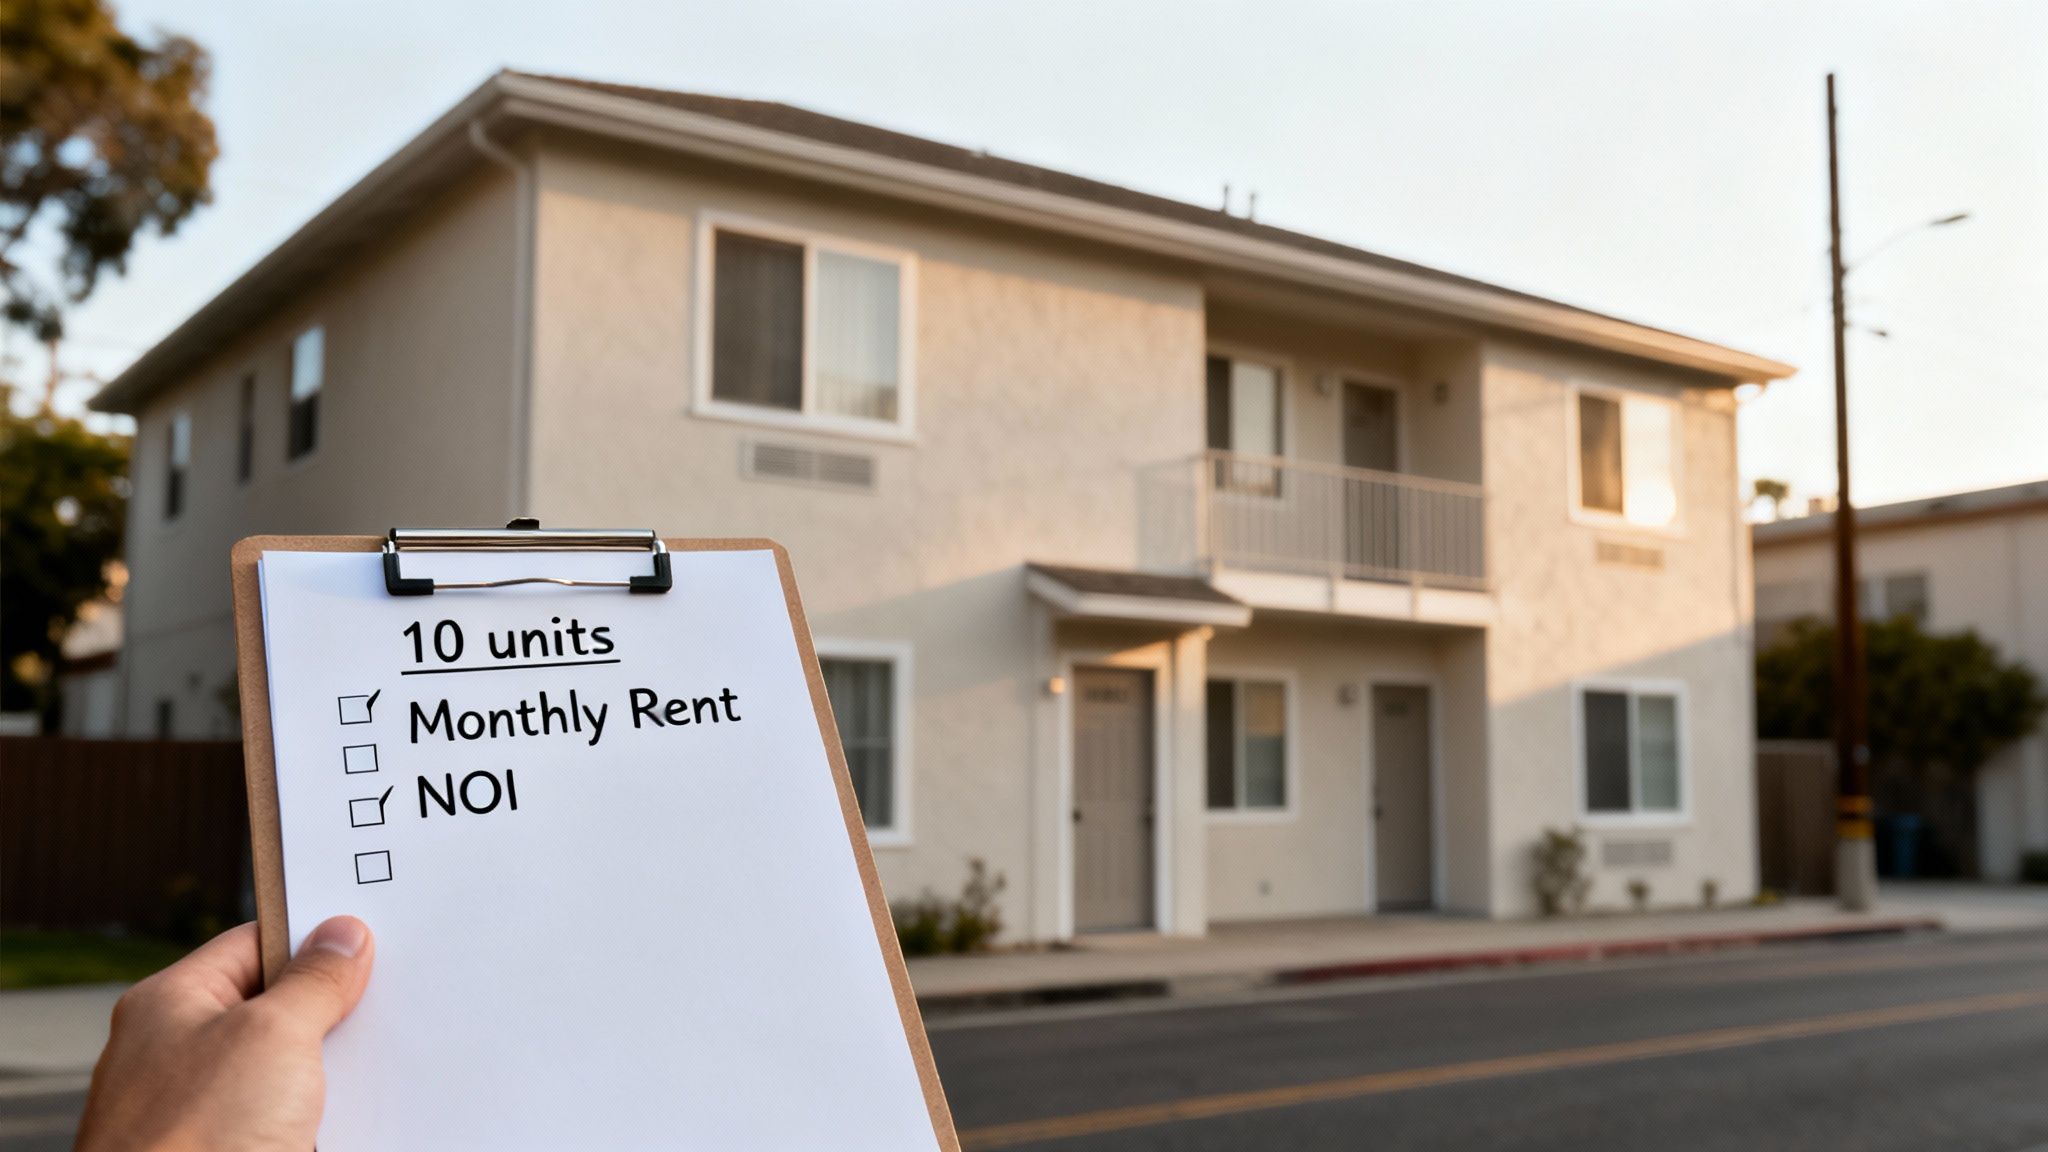
Let’s imagine you're looking at a 10-unit apartment building with an asking price of $2,000,000. We're going to break down every piece of income and every expense to find its cap rate.
Step 1: Gather the Income Figures
First, let's figure out how much money this building could make. We'll start with the rent and then add other income sources.
Each of the 10 units rents for $1,800 per month. That gives us a monthly gross rent of $18,000. Annually, that’s a Gross Potential Income (GPI) of $216,000.
But that's not all. This building also has a coin-operated laundry room that brings in about $400 a month, which adds another $4,800 a year. So, our total potential income is now $220,800.
Step 2: Adjust for Vacancy and Losses
Now for a dose of reality. No property is full 100% of the time. We need to account for this by applying a vacancy factor to find our Effective Gross Income (EGI).
Looking at similar buildings in the area, a 5% vacancy rate is a safe bet. This covers empty units between tenants and the occasional missed rent payment.
- Vacancy & Collection Loss: $216,000 (Gross Potential Rent) x 5% = $10,800
We subtract this from our total potential income to get a more realistic number:
- Effective Gross Income (EGI): $220,800 - $10,800 = $210,000
This EGI of $210,000 is the true starting point for figuring out the property's profitability.
Step 3: Itemize the Operating Expenses
This is where you need to be honest with yourself. Underestimating expenses can make a bad deal look great on paper. We need to account for every cost required to keep this building running for a year.
Here’s a realistic breakdown of the annual operating expenses:
- Property Taxes:$25,000 (From local tax records)
- Insurance:$8,000 (For a landlord policy)
- Property Management:$16,800 (Standard 8% of EGI: $210,000 x 0.08)
- Repairs & Maintenance:$10,500 (A conservative 5% of EGI)
- Utilities (Owner-Paid):$12,000 (Covers water, sewer, trash, common area electricity)
- Landscaping & Snow Removal:$4,000
- General Admin & Miscellaneous:$2,000 (For accounting, legal, etc.)
When you add it all up, the total annual operating expenses come to $78,300.
Step 4: Calculate the Final NOI and Cap Rate
We now have our two key numbers: Effective Gross Income and Total Operating Expenses. The next step is simple subtraction to find our Net Operating Income (NOI).
- NOI Calculation: $210,000 (EGI) - $78,300 (Expenses) = $131,700
With an NOI of $131,700 and our purchase price of $2,000,000, we can finally plug everything into the cap rate formula.
Cap Rate Formula: Net Operating Income / Purchase Price
Our Example: $131,700 / $2,000,000 = 0.06585
Expressed as a percentage, this property has a cap rate of 6.59%.
Quick Reference: Calculation Breakdown
This table shows exactly how we got from the gross income all the way to the final cap rate for our example 10-unit apartment building.
| Metric | Calculation/Notes | Amount |
|---|---|---|
| Gross Potential Rent | 10 units x $1,800/mo x 12 | $216,000 |
| Other Income | Laundry: $400/mo x 12 | $4,800 |
| Gross Potential Income | Gross Rent + Other Income | $220,800 |
| Vacancy & Loss (5%) | $216,000 x 0.05 | ($10,800) |
| Effective Gross Income | GPI - Vacancy | $210,000 |
| Total Operating Expenses | Sum of all annual costs | ($78,300) |
| Net Operating Income (NOI) | EGI - Expenses | $131,700 |
| Purchase Price | Asking price for the building | $2,000,000 |
| Cap Rate | NOI / Purchase Price | 6.59% |
This step-by-step breakdown demystifies the process, showing that a cap rate is simply a reflection of the property's income potential relative to its price, after all operating costs are paid. You can learn more about how market forces influence the capitalization rate on a rental property to see how these factors play out.
What Is a Good Cap Rate for a Rental Property?
You’ve run the numbers and now you’re staring at a percentage like 6.59%. What does that actually mean? This isn't just an abstract number; it's a powerful snapshot of a property's risk and potential return. Understanding this is what separates a calculated investment from a blind guess.
There is an inverse relationship between property prices and cap rates. When property values in a hot market go up, cap rates tend to go down. On the other hand, when prices cool off, cap rates usually climb.
This happens because in high-demand, high-price areas, investors are often willing to accept a smaller annual return (a lower cap rate) in exchange for a safer, more stable asset with a good chance of long-term appreciation.
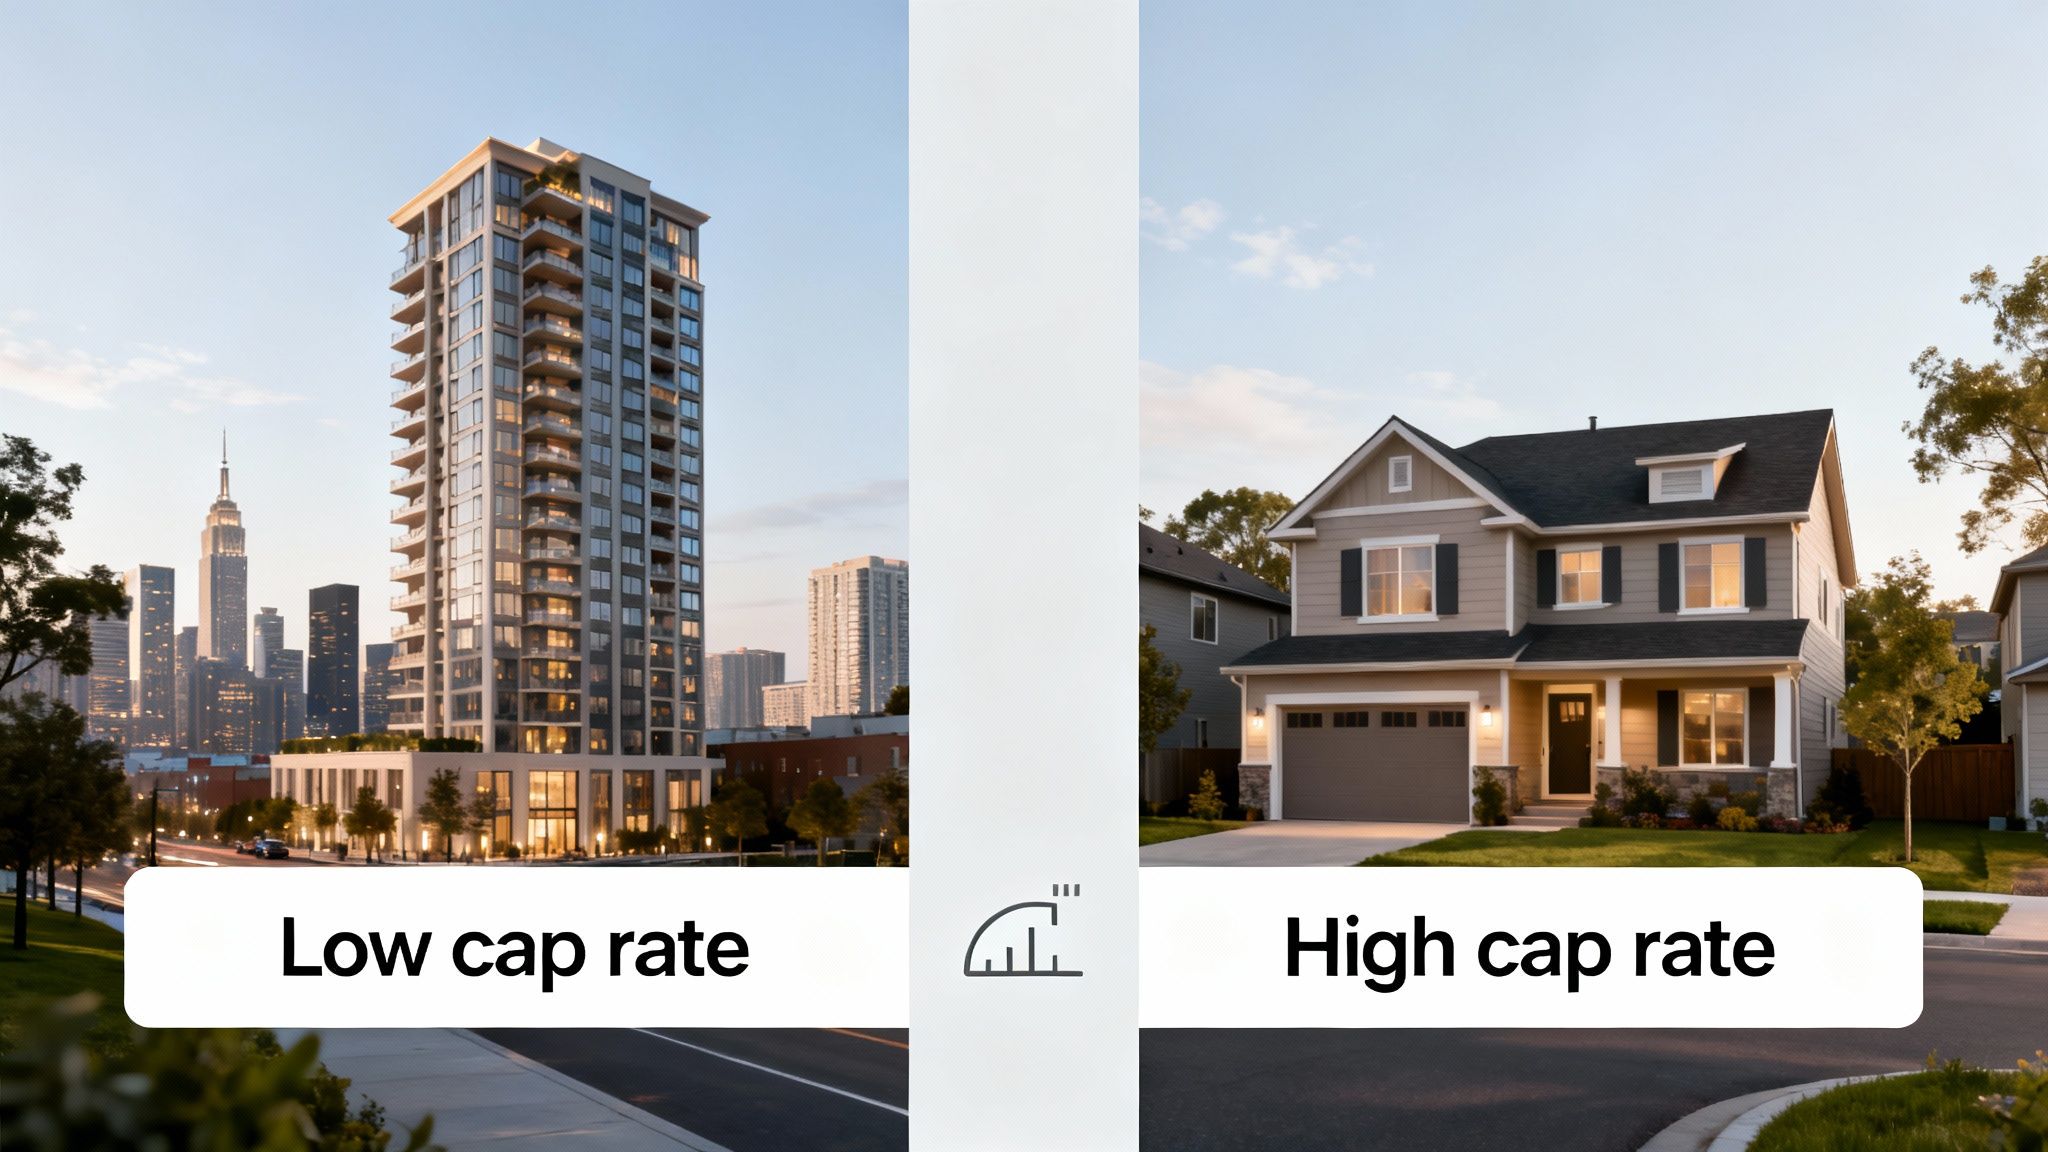
High Cap Rate vs. Low Cap Rate
Let's be clear: there's no magic number for a "good" cap rate. It all depends on the market, the property type, and your personal investment goals. A rate that looks amazing in one city could be a huge red flag somewhere else.
- Low Cap Rate (think 3-5%): This usually points to a lower-risk, higher-demand property, like a modern apartment in a prime downtown location. Investors pay a premium for that stability and accept a smaller annual cash return.
- High Cap Rate (think 8-10%+): This often signals a higher-risk deal, but with the potential for much better returns. It might be an older building in an up-and-coming neighborhood or a property in a less stable market. The higher return is your reward for taking on extra risk.
Quick Takeaway: A lower cap rate often means lower risk and lower cash flow. A higher cap rate usually means higher risk and higher potential cash flow. Your goal is to find a property where the return justifies the risk you're taking on.
For a deeper look at finding your sweet spot, check out this guide on what is a good cap rate.
How the Broader Economy Changes the Game
Cap rates don't exist in a vacuum. They’re heavily influenced by the larger economy, especially interest rates. When the cost of borrowing money goes up, investors demand higher returns (higher cap rates) from properties to make the investment worthwhile.
We’ve seen this happen recently. Between 2021 and 2024, as central banks hiked interest rates, cap rates began to climb. Industry reports from firms like CBRE showed cap rates for many properties jumping by 1.0% to 1.5%. This was a direct reaction to higher financing costs.
Understanding this dynamic is crucial. It shows that a cap rate isn't just about one building—it's a reflection of the entire investment landscape.
Common Cap Rate Calculation Mistakes to Avoid
Calculating a cap rate isn't difficult, but a few common slip-ups can lead to a costly mistake. Getting your numbers right is every bit as important as the formula itself. Steer clear of these frequent errors to ensure your analysis is reliable.
One of the biggest traps for new investors is blindly trusting the seller's "pro-forma" numbers. A pro-forma is just a projection of a property's potential income and expenses, and it almost always paints an overly optimistic picture.
Always insist on seeing the actual historical data for the last 12-24 months, often called a "trailing 12" or "T-12." This grounds your analysis in reality.
Forgetting Key Operating Expenses
It’s easy to remember the big costs like property taxes. But it's the smaller, recurring expenses that can silently eat away at your profits. Underestimating your total expenses will artificially inflate your NOI and your cap rate, making a deal look better than it is.
To avoid this, create a checklist of expenses, including these often-overlooked items:
- Property Management Fees: Even if you plan to self-manage, account for this cost (usually 8-10% of Effective Gross Income). This values your own time and keeps your analysis comparable to other investments.
- Capital Expenditure (CapEx) Reserves: This isn't a typical operating expense, but you must budget for it. Setting aside 2-4% of your EGI for future big-ticket replacements—like a new roof or HVAC system—is crucial for long-term financial health.
- Vacancy Allowance: Assuming 100% occupancy is a rookie mistake. Use a realistic vacancy rate for your market (typically 5% to 8%) to account for the time units will sit empty.
Including Mortgage Payments in Your NOI
This is the most fundamental error you can make when calculating cap rate. Your Net Operating Income must never include your mortgage payment (principal and interest). Remember, the cap rate is designed to evaluate the property's performance independent of your personal financing.
Key Takeaway: The cap rate measures the property's profitability, not your return after debt. By excluding the mortgage, you can compare a property you're financing against one you're buying with cash on an apples-to-apples basis.
If you want to analyze your return with financing, you should use the Cash-on-Cash Return metric instead, which is designed for that purpose.
Other Metrics to Use with Cap Rate
While the cap rate is an excellent starting point, it doesn't tell the whole story. To get a complete picture of an investment, especially when you're using a loan, you should look at a few other key numbers.
These additional metrics give you a more complete view of a deal, from immediate cash flow to long-term profitability.
Cash-on-Cash Return
If you're using a mortgage, the Cash-on-Cash Return is arguably the most important metric. It answers a simple, critical question: "For every dollar I put into this deal out of my own pocket, how much am I getting back each year?"
This metric compares your annual pre-tax cash flow to the total cash you invested, including your down payment and closing costs.
Why It's Essential: Cap rate ignores financing, but Cash-on-Cash Return puts it front and center. It shows you the real-world performance of your invested capital. To see how this powerful metric works, explore our guide on what is a good cash on cash return.
Gross Rent Multiplier
The Gross Rent Multiplier (GRM) is a simpler, "back-of-the-napkin" metric for quick comparisons. It’s calculated by dividing the property’s price by its gross annual rental income.
- Formula: GRM = Property Price / Gross Annual Rent
Because it doesn't factor in any expenses, the GRM isn't a tool for a final decision. However, it’s useful for quickly filtering a long list of potential properties to see which ones might be undervalued relative to the rent they bring in.
Return on Investment (ROI)
Finally, Return on Investment (ROI) offers the broadest view of your total profit over the entire life of the investment.
Unlike cap rate or cash-on-cash return, which are annual snapshots, ROI considers your total gain from all sources—including the property's increase in value (appreciation) and the principal you've paid down on your loan—when you eventually sell.
Frequently Asked Questions
Here are answers to some common questions new buyers have about calculating cap rate.
1. Why isn't my mortgage payment included in the cap rate calculation?
The cap rate is designed to measure the property's performance on its own, independent of your personal financing. By leaving out the mortgage, you can compare different properties on a level playing field, regardless of how they are purchased. To analyze your return with financing, you should use the Cash-on-Cash Return metric instead.
2. How do I know what a "good" cap rate is for my area?
A good cap rate depends entirely on the local market. What's considered great in one city might be low in another. The best way to find a benchmark for your area is to talk to investor-focused real estate agents, analyze recent sales of similar properties, and look at market reports from commercial real estate firms. The key is to compare apples to apples: similar properties in the same neighborhood.
3. What's the difference between cap rate and ROI?
Think of it this way: Cap Rate is a snapshot of a property's potential return in a single year, without considering financing. It's about the property's current performance. Return on Investment (ROI) is the big-picture measurement of your total profit over the entire time you own the property, from purchase to sale, including appreciation and loan paydown.
Ready to analyze deals faster and with more confidence? Flip Smart takes the guesswork out of calculating cap rate and other critical metrics. Analyze any property in seconds and make smarter investment decisions. Get your comprehensive property report at https://flipsmrt.com.