When you're sizing up a potential rental property, you need a way to quickly decide if it's worth a deeper look. The Gross Rent Multiplier (GRM) is one of the best back-of-the-napkin tools for exactly that.
In the simplest terms, the GRM tells you how many years of gross rent it would take to pay back the property's purchase price. Think of it as a gut check—a way to quickly compare the price of a property to the income it generates, long before you start digging into the nitty-gritty of operating expenses.
Understanding the Gross Rent Multiplier

I like to call the GRM a "price tag scanner" for real estate. Just like a scanner in a store instantly gives you a price, the GRM gives you an immediate read on whether a property is priced reasonably for its income potential. It helps you spot deals that might be undervalued—or flag the ones that are way overpriced—at a glance.
This metric is a fundamental first step for investors. It's calculated by dividing the property’s sale price by its annual gross rental income. The key here is gross—we're not worrying about taxes, insurance, or maintenance just yet.
For example, say a property is listed for $200,000 and brings in $750 per month in rent. The annual gross rent is $9,000 ($750 x 12). The GRM would be 22.22 ($200,000 / $9,000). For more on how this applies to different properties, you can review these insights on the Gross Rent Multiplier.
The Basic Formula Breakdown
The beauty of the GRM is its simplicity. You only need two numbers, which makes it a fantastic tool for quickly comparing multiple properties on an apples-to-apples basis before you commit hours to a full financial workup.
The formula is dead simple:
GRM = Property Price / Gross Annual Rental Income
Let's break down each piece so you know exactly what you're working with.
Gross Rent Multiplier At a Glance
Here's a quick summary table to keep the components straight.
| Component | What It Means | Example |
|---|---|---|
| Property Price | The asking price or current market value of the property. This is your initial capital outlay. | $250,000 |
| Gross Annual Rent | The total potential rent collected in one year, before any expenses like vacancies, repairs, or taxes are paid. | $25,000 per year |
| GRM (The Result) | A multiplier showing how many years of gross rent it would take to cover the property price. | 10 (250k / 25k) |
This table highlights just how straightforward the calculation is, relying on top-line numbers for a quick assessment.
What Does the GRM Tell You?
The number you get from the GRM formula isn't a dollar amount or a percentage; it's a multiplier. And when it comes to GRM, a lower number is generally better.
A lower GRM suggests the property's price is relatively low compared to the income it can generate. For instance, a property with a GRM of 8 would theoretically take 8 years of gross rent to pay for itself. Another one with a GRM of 12 would take 12 years.
This makes the GRM an incredible first-pass filter. It lets you quickly weed out properties that don't align with your goals, saving you from wasting precious time on deals that were never going to pencil out anyway.
How To Calculate GRM With Real-World Examples
Calculating the Gross Rent Multiplier is a quick, three-step process that gives you a fast snapshot of a property's value relative to its income. Think of it as a foundational metric for any investor who needs to compare opportunities on the fly.
This visual guide breaks down exactly how the calculation works.
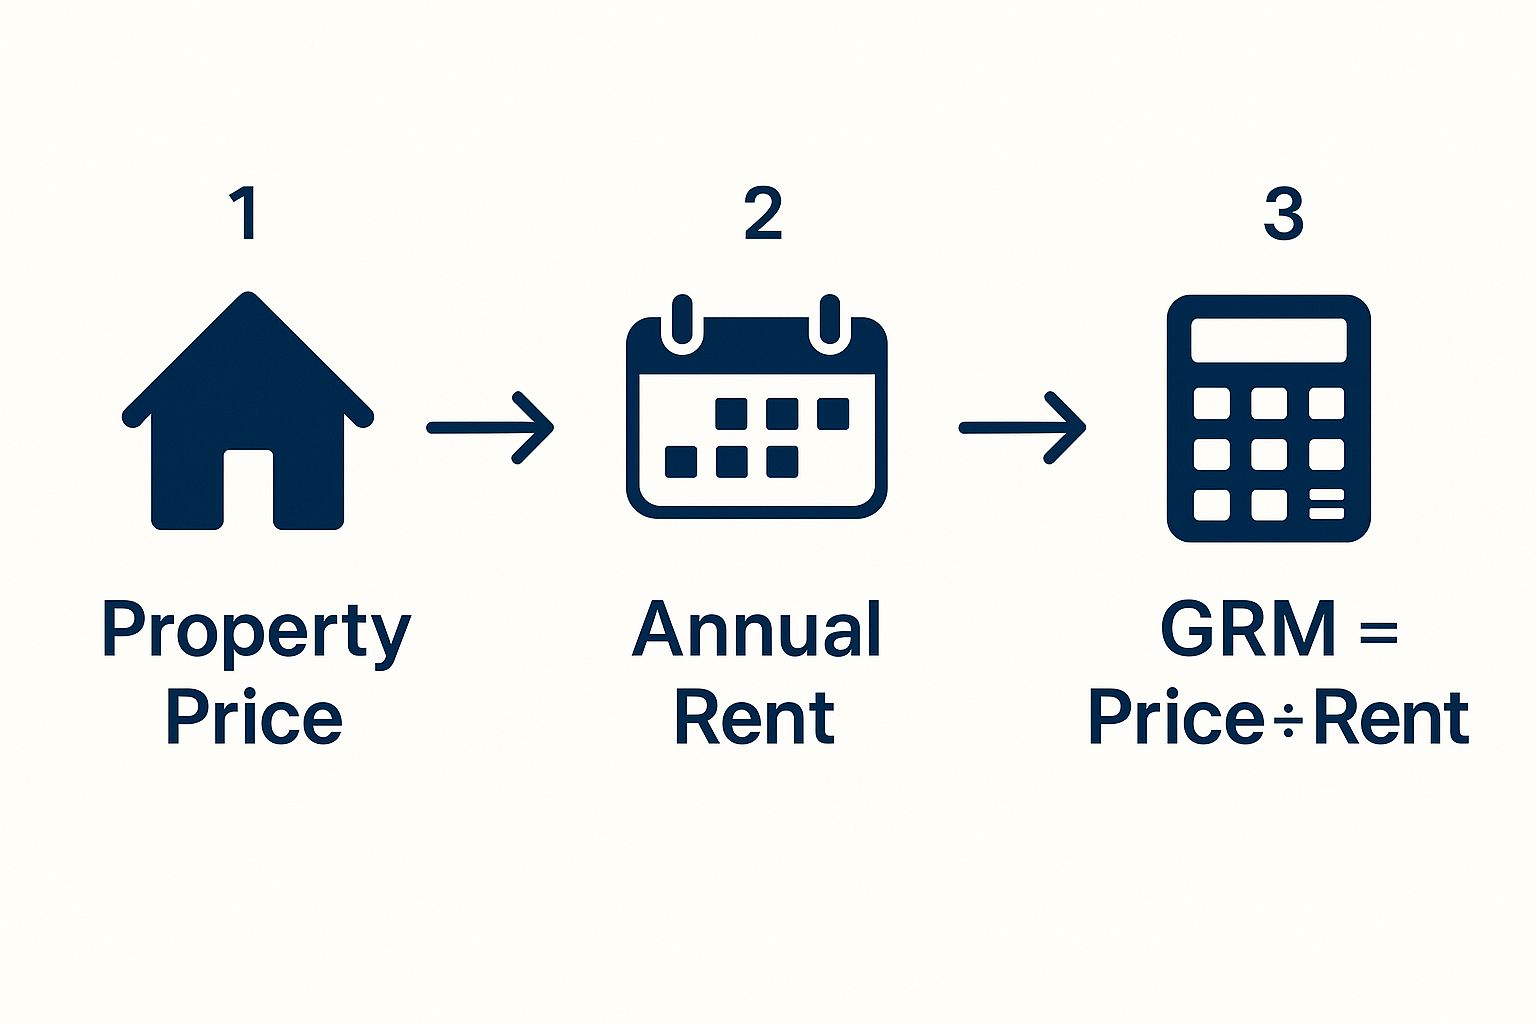
As you can see, the process is dead simple: you take the property's price, figure out its annual rent, and then divide the first number by the second. That simplicity is precisely what makes GRM so useful for an initial screening.
The entire process boils down to this straightforward formula:
GRM = Property Price / Gross Annual Rental Income
Let's walk through this with a couple of distinct, real-world examples to see how the numbers play out for different types of properties. This will help you get a feel for how GRM can vary and what it's really telling you in each scenario.
Example 1: The Suburban Single-Family Home
Imagine you're eyeing a single-family home in a quiet suburban neighborhood. The property is listed for $350,000, and you know that the current market rent for similar homes in that area is $2,500 per month.
Here’s the step-by-step breakdown:
- Identify the Property Price: The price is $350,000.
- Calculate the Gross Annual Rent: Just multiply the monthly rent by 12.
- $2,500/month x 12 months = $30,000/year
- Calculate the GRM: Now, divide the price by that annual rent figure.
- $350,000 / $30,000 = 11.67
The GRM for this suburban home is 11.67. In simple terms, this means it would take almost 12 years of gross rental income to cover the purchase price—and that’s before accounting for a single expense.
Example 2: The Urban Multi-Family Unit
Now, let's switch gears and look at a small multi-family duplex in a denser urban area. The asking price is $480,000. Each of the two units rents for $2,200 per month, giving you a total monthly rent of $4,400.
Let's run the same formula:
- Identify the Property Price: The list price is $480,000.
- Calculate the Gross Annual Rent:
- $4,400/month x 12 months = $52,800/year
- Calculate the GRM:
- $480,000 / $52,800 = 9.09
For this duplex, the GRM is 9.09. Notice how it's quite a bit lower than the single-family home, which suggests a faster payback period based on gross rents alone.
Of course, while GRM is an excellent starting point, a full financial picture requires a much deeper dive. For a more detailed guide on what comes next, learn how to analyze property cash flow step-by-step.
Interpreting GRM: What Makes a Good Number?

So you've calculated the Gross Rent Multiplier and you're staring at a number. A 7. A 12. A 15. What does it actually mean? Interpreting the GRM is more art than science, because a "good" number is completely relative.
The most important rule of thumb is that a lower GRM is generally better. A lower number signals that a property's purchase price is low compared to its potential gross income. Think of it as a rough payback period—a lower GRM means it takes fewer years for the gross rent to theoretically cover the purchase price.
But here’s the catch: there's no such thing as a universally "good" GRM. The number is massively influenced by the property’s location, its condition, and the overall health of the local market. What might be a fantastic GRM in a quiet Midwestern town would be an impossible dream in a hot coastal city.
Why Market Context is Everything
When you're working with GRM, context is king. A property in a booming city with rapid appreciation might have a high GRM, and investors will gladly accept it because they're betting on long-term growth. On the flip side, a property in a slower market might offer a deliciously low GRM, indicating strong immediate cash flow but maybe less exciting appreciation down the road.
This is exactly why you can't compare the GRM of a duplex in Austin, Texas, to a single-family home in Omaha, Nebraska, and draw any meaningful conclusion. The metric is most powerful when you use it to compare similar properties in the same hyper-local market.
A "good" GRM is a moving target that shifts from one neighborhood to the next. The key isn't finding a magic number, but understanding what’s typical for your specific investment area. This is how you spot the true outliers and potential deals.
In stable U.S. cities, residential GRMs often fall somewhere between 7 and 12. A GRM closer to 7 looks pretty attractive, while numbers pushing past 15 or 20 are common in high-demand areas where prices have shot through the roof. For more on this, Trion Properties offers some great insights on what makes a good GRM.
Typical GRM Ranges by Market Type
To give you a better feel for this, let's look at how GRM can vary across different market types. This table breaks down the general ranges you might see and what they mean for your investment strategy.
| Market Type | Typical GRM Range | Investment Implication |
|---|---|---|
| High-Growth Urban Core | 10 - 15+ | Investors often accept a higher GRM, banking on future rent growth and property appreciation. Cash flow may be tighter initially. |
| Stable Suburban Area | 8 - 12 | This range often represents a balanced investment, offering a reasonable payback period alongside steady, predictable demand. |
| Emerging/Tertiary Market | 5 - 9 | A lower GRM here typically points to stronger immediate cash flow but may come with higher risk or lower appreciation potential. |
As you can see, the number itself doesn't tell the whole story. An investor focused on cash flow might hunt for properties with a GRM of 5-9 in emerging markets, while an appreciation-focused investor might be perfectly happy with a 12 in a rapidly growing urban center. Your strategy dictates what a "good" GRM looks like for you.
Understanding the Limitations of GRM
While the Gross Rent Multiplier is a fantastic tool for a quick first look, relying on it alone can be a costly mistake. Think of it as a book's cover—it gives you a general idea, but it doesn’t tell you the whole story inside.
The GRM’s biggest blind spot is that it completely ignores a property's operating expenses.
This is a critical omission. Expenses like property taxes, insurance, maintenance, and vacancy rates can completely change a property's real profitability. If you're not factoring in these costs, you’re only seeing half the financial picture.
Let's imagine you're comparing two properties. They're both priced at $300,000 and each generates $30,000 in annual gross rent. On paper, they have the exact same GRM of 10.
- Property A is a brand-new build with low maintenance needs and energy-efficient systems.
- Property B is a 50-year-old building with an aging roof, original plumbing, and high property taxes.
The GRM makes them look like twins. But in reality, Property B is a financial time bomb waiting to go off. Its operating expenses will be significantly higher, eating into your profits and revealing it as the far weaker investment. The GRM simply cannot show you this crucial difference.
Why It's a Screening Tool, Not a Final Verdict
This is exactly why seasoned investors treat the GRM as a preliminary screening tool, not a final decision-maker. It’s perfect for rapidly sifting through dozens of listings to build a shortlist of potential deals. Once you have that list, though, you have to dig deeper.
The GRM is most effective when you're comparing very similar properties—like two nearly identical townhouses in the same subdivision. In that scenario, you can reasonably assume their operating expenses will be pretty close.
The GRM's value lies in its speed, not its depth. It helps you ask the right questions, but it doesn't provide all the answers. A low GRM is an invitation to investigate further, not an immediate green light to buy.
Essentially, the GRM helps you compare apples to apples where expenses and depreciation are relatively uniform. This is where it differs from more comprehensive metrics like the capitalization rate (cap rate), which uses net operating income instead of gross income. By subtracting expenses first, the cap rate provides a much clearer picture of your actual annual return. You can learn more about how GRM and cap rate differ to get a full understanding.
GRM vs Cap Rate: Which Metric to Use and When

If the Gross Rent Multiplier is the quick glance you take at a property's price tag, then the Capitalization (Cap) Rate is the full-on mechanical inspection. While both are critical tools in an investor's belt, they're built for entirely different jobs.
The biggest difference between them comes down to one simple but crucial word: expenses.
GRM is a blunt instrument that looks only at gross income, completely ignoring every single cost that comes with owning and operating a property. The Cap Rate, on the other hand, is calculated using Net Operating Income (NOI), which gives you a much sharper picture of a property’s real-world profitability.
To get the NOI, you just take your gross rental income and subtract all the operating expenses—think taxes, insurance, maintenance, and property management fees.
The Cap Rate formula is:
Cap Rate = Net Operating Income / Property Price
That simple switch from gross to net income is what makes the Cap Rate an infinitely more powerful tool for serious financial analysis.
When Expenses Tell the Real Story
Let's go back to our two properties that looked identical through the lens of GRM. Both are on the market for $400,000 and pull in $40,000 in gross annual rent, giving them both a GRM of 10. On the surface, it’s a tie.
But now, let's bring expenses into the picture to calculate their Cap Rates.
Property A (Newer Build): This place is in great shape, with low annual operating expenses of just $8,000.
- NOI = $40,000 - $8,000 = $32,000
- Cap Rate = $32,000 / $400,000 = 8%
Property B (Older Build): This one is a bit of a money pit. Higher property taxes and constant maintenance add up to $15,000 in annual expenses.
- NOI = $40,000 - $15,000 = $25,000
- Cap Rate = $25,000 / $400,000 = 6.25%
Just like that, the better investment becomes crystal clear. Property A is the obvious winner, delivering a much healthier return once you factor in its lower costs. The Cap Rate uncovered a critical truth that the GRM completely glossed over.
Deciding Which Metric to Use
So when do you pull out the GRM, and when do you run the numbers for a Cap Rate? The best way to think about it is as a two-step process in your deal analysis workflow.
Use GRM for rapid, high-level screening. When you're sifting through dozens of potential deals online, GRM is your best friend. It helps you quickly weed out the wildly overpriced properties and build a shortlist of contenders without getting bogged down in the details.
Use Cap Rate for deep financial due diligence. Once you have that shortlist, the Cap Rate is non-negotiable. This is how you compare the true profitability of your top choices and make a final decision based on real numbers, not just potential.
It’s also worth remembering that GRM doesn’t account for how you finance the deal. Using a mortgage dramatically changes your actual return and payback period, something GRM is blind to. That's why seasoned investors almost exclusively use GRM as a quick filter before moving on to more robust metrics.
Mastering both of these metrics is a non-starter for any serious investor. You can dive deeper into the numbers with our complete guide to real estate math formulas. Knowing which tool to use and when will help you make faster, smarter, and ultimately more profitable investment decisions.
Your Actionable Rental Property Analysis Checklist
Alright, let's turn theory into a repeatable process you can use on every deal. A solid analysis workflow is what separates seasoned investors from rookies—it’s how you move from a casual glance at a listing to a confident, data-backed decision without getting lost in the weeds.
Think of this checklist as your investment game plan. We start with a wide-angle lens to quickly filter out the junk, then zoom in on the details that matter. This ensures you only spend your precious time on opportunities that actually have a shot.
Step 1: Use GRM for the Initial Screen
Your first move, every single time, should be a lightning-fast GRM calculation. As you're scrolling through listings, any property that piques your interest gets the Gross Rent Multiplier test. It’s the ultimate first-look metric for instantly comparing properties and kicking the obviously overpriced ones to the curb.
- Action Item: Pull up five comparable rental listings in your target neighborhood and calculate the GRM for each. This gives you a baseline for the area, making it dead simple to spot a deal with a good-looking (lower) GRM.
Step 2: Dig Into the Real Costs—Operating Expenses
A property that passes the GRM test has earned a closer look. Now it's time to get real about the costs of ownership. The gross rent is just the starting point; what you really care about is what's left over. Reach out to the seller's agent or do some sleuthing to nail down the key operating expenses.
You'll want to track down:
- Property Taxes
- Homeowners Insurance
- Estimated Maintenance and Repairs (the 1% rule—budgeting 1% of the property value annually—is a decent starting point)
- Property Management Fees (if you're not self-managing)
- HOA Dues
Step 3: Calculate the Cap Rate
With a handle on your expenses, you can now calculate the Cap Rate. This metric gives you a much sharper picture of a property's true profitability because it uses Net Operating Income (NOI), not just the fantasy-land figure of gross rent. A healthy Cap Rate confirms that the potential you saw with the GRM holds up under real financial pressure.
Key Takeaway: The GRM gets a property on your shortlist. The Cap Rate and a full cash flow analysis tell you if it’s a winner. The Gross Rent Multiplier is just the first filter, never the final word.
Step 4: Go All-In with Full Due Diligence
If the numbers are still looking strong, it's go-time. This is where you move beyond the spreadsheet and into the physical world with inspections, legal checks, and deep market analysis. To make sure you don't miss a single thing, run through our complete real estate due diligence checklist. It’s your roadmap to covering all your bases before you sign on the dotted line.
Frequently Asked Questions About GRM
Once you get the hang of the Gross Rent Multiplier, you start running into real-world questions. It's one thing to know the formula, but another to apply it confidently when analyzing a deal.
Let's clear up a few of the most common questions that pop up for investors.
Can I Use Monthly Rent to Calculate GRM?
No, you should always stick with the gross annual rental income. It's tempting to grab the monthly number for a quick calculation, but that's a classic rookie mistake.
The whole point of GRM is to create an apples-to-apples comparison between properties. Using the annual figure is the industry standard that makes this possible and keeps your analysis consistent.
Does GRM Account for Property Vacancy?
This is a big one: GRM does not factor in vacancy. The calculation uses the potential gross rent, which assumes the property is filled 100% of the time.
Of course, that’s rarely the reality. Vacancy can take a serious bite out of your actual income, which is why GRM is best used as a quick screening tool before you dive into a more detailed cash flow analysis.
The GRM gives you a best-case-scenario snapshot based on potential income. It’s your job to investigate the real-world factors, like vacancy and other expenses, that will affect your bottom line.
How Does Financing Affect the GRM Calculation?
Financing has zero impact on the GRM calculation. The metric only cares about two things: the property's purchase price and its gross rental income.
It's a debt-agnostic metric, meaning it doesn't matter if you're paying all cash or getting a mortgage. This simplicity is intentional—it lets you evaluate the property's income potential on its own, separate from your personal financing strategy.
Ready to stop guessing and start analyzing with precision? Flip Smart lets you analyze any property in seconds, providing accurate valuations, renovation costs, and profit potential without the manual work. Make smarter investment decisions today.