Every successful real estate investor relies on one indispensable tool: a meticulously crafted rental property analysis spreadsheet. It's the critical asset that separates calculated, profitable investments from costly gambles. This guide will show you how to build and use a spreadsheet that transforms raw property data into a clear, actionable verdict on its true financial potential.
Why a Spreadsheet Is Every Investor's Best Friend

Before diving into formulas, let's establish why this tool is non-negotiable for serious investors. Think of it as your financial command center for vetting every potential deal. Without it, you’re operating on gut feelings and hoping for the best—a risky strategy in any market.
A well-structured spreadsheet forces you to move beyond optimistic assumptions. It provides a standardized framework to compare multiple properties side-by-side, ensuring you evaluate every opportunity using the same rigorous criteria. This consistency is the key to making unbiased, data-driven decisions instead of emotional ones.
From Speculation to Actionable Strategy
Your spreadsheet is the bridge from complex property data to a simple "go" or "no-go" decision. It sharpens your ability to forecast cash flow with precision and, more importantly, illuminates the hidden expenses often overlooked in a quick, back-of-the-napkin calculation.
Here’s where it delivers actionable value:
- Revealing Hidden Costs: It compels you to account for deal-killers like vacancy rates, capital expenditures (CapEx), and property management fees that are often ignored.
- Standardizing Comparisons: You can create a true "apples-to-apples" comparison between a duplex in one neighborhood and a single-family home across the city, removing guesswork.
- Calculating Key Metrics: It serves as your single source of truth for critical performance indicators like Cap Rate and Cash-on-Cash Return. For investors looking to streamline this process, leveraging automated property analysis can be a game-changer.
- Strengthening Negotiations: Entering negotiations armed with a detailed analysis gives you incredible leverage. You can confidently justify your offer with hard data.
A spreadsheet doesn't just crunch numbers; it builds your confidence. When you can clearly articulate why a deal works—or why it doesn't—you invest with authority.
Navigating a Growing Market
The need for precise analysis is more critical now than ever. The global real estate rental market, currently valued at around USD 2.69 trillion, is projected to expand to approximately USD 3.87 trillion by 2029.
This growth means more competition and a smaller margin for error. A robust rental property analysis spreadsheet isn't just for analyzing one deal; it's for building a repeatable, scalable system for long-term wealth creation.
Laying the Groundwork for an Accurate Analysis

Your rental property analysis spreadsheet is a powerful tool, but it's only as reliable as the data you feed it. The adage "garbage in, garbage out" has never been more relevant than in real estate investing.
The real work begins before you open Excel or Google Sheets. It's about gathering the hard numbers that will ground your analysis in reality, not optimistic guesses. This initial data collection phase is what separates professional investors from those who are constantly blindsided by unexpected costs.
Compiling Your Purchase and Startup Costs
First, you must accurately determine the total cost to acquire the property. This extends far beyond the list price. You need a complete picture of your initial cash outlay to calculate your true return on investment.
Start with these fundamental inputs:
- Purchase Price: The agreed-upon sale price.
- Down Payment: For investment properties, this is typically a minimum of 20-25%.
- Loan Details: Know the exact interest rate, loan term (usually 30 years), and any points paid to the lender.
- Closing Costs: These often surprise new investors. Budget 2-5% of the purchase price for appraisal fees, title insurance, attorney costs, and more.
- Initial Repair Estimates: Be brutally honest. What will it actually cost to make the property rent-ready?
Actionable Tip: Don't rely on the listing sheet. Verify property taxes on the county assessor's website, get a real insurance quote from an agent, and walk the property with a contractor for rehab estimates. Accuracy at this stage prevents major financial headaches later.
Projecting Your Ongoing Operations
Once you know the cost to buy, you must accurately forecast the cost to own. This is where many investors falter, underestimating the recurring expenses that erode profits. Meticulous research here is non-negotiable.
Your operational data should include:
- Projected Rental Income: Research what comparable rentals (comps) in the immediate area are currently leasing for. Don't use the seller's number without verification.
- Property Taxes: Never assume the seller's tax bill will be yours. A sale often triggers a reassessment. Check with the local tax authority.
- Insurance Premiums: Call an agent and get a specific quote for a landlord policy, which differs from a standard homeowner's policy.
- HOA Fees: If applicable, verify the monthly dues and request the HOA's financial statements to check for potential special assessments.
Beyond these, you must account for the "invisible" expenses that can destroy cash flow. These are the inputs that distinguish a professional rental property analysis spreadsheet from an amateur one. Always factor in a percentage of gross rent for vacancy (a conservative 5-10% is standard), property management fees (typically 8-12%), and capital expenditures (CapEx) for major items like a new roof or HVAC system.
Gathering this data is a core part of your initial investigation, mirroring the process in a comprehensive real estate due diligence checklist. With this solid foundation, your spreadsheet will become the reliable decision-making machine you need it to be.
Building Your Income and Expense Modules
With your data gathered, it's time to construct the engine of your rental property analysis spreadsheet. Here, we'll lay out income and expenses to turn a blank slate into a powerful financial forecasting tool. A clean, detailed setup is crucial for an accurate financial picture.
Let's start with income. A common mistake is plugging in the gross monthly rent and stopping there. To build a model that reflects reality, you must account for every single dollar the property can generate. This is how you calculate your true Gross Operating Income (GOI).
Capturing All Potential Income
While base rent is the main driver, ancillary fees can significantly boost your bottom line. Thinking beyond the standard monthly payment is what separates amateur analysis from a professional one. Your spreadsheet should have a specific line item for each potential revenue stream.
Your income module should include:
- Monthly Rent: The primary income from the tenant.
- Pet Fees: Whether a one-time deposit or monthly "pet rent," it must be tracked.
- Parking Fees: If you charge for a covered spot or reserved space, that's income.
- Laundry/Vending: For multifamily properties, coin-operated machines provide a steady income stream.
- Storage Fees: Renting out a shed or basement storage cage? Track that income separately.
Breaking these out provides a crystal-clear view of your revenue mix and helps you identify opportunities to increase income.
Structuring the Expense Module
Next is the expense module, which demands even greater attention to detail. This is where deals are truly made or broken. We'll categorize costs into two groups: fixed expenses (consistent every month) and variable expenses (which fluctuate).
Actionable Tip: A well-organized expense module tells a story about the property's financial health. Separating fixed from variable costs makes it easier to forecast cash flow and identify areas for potential savings.
Fixed expenses are predictable and easier to budget for:
- Mortgage Payment (P&I): The principal and interest payment to the lender.
- Property Taxes: Take the annual bill and divide by 12.
- Insurance: Your annual landlord policy premium, also divided by 12.
- HOA Dues: A set monthly fee if the property is in an HOA.
Variable expenses are what often catch new investors by surprise. The professional way to handle these is to budget for them as a percentage of gross rent. This transforms unpredictable costs into a planned, monthly line item.
To help you build an accurate forecast, here's a breakdown of essential expense categories and the budgeting estimates used in professional models.
Essential Expense Categories and Budgeting Estimates
| Expense Category | Description | Typical Budget (% of Gross Rent) |
|---|---|---|
| Vacancy | Funds set aside for periods when the unit is unoccupied between tenants. | 5% - 10% |
| Repairs & Maintenance | Covers routine upkeep like leaky faucets, appliance fixes, or a broken lock. | 5% - 10% |
| Capital Expenditures (CapEx) | Savings for major, big-ticket replacements like a new roof, HVAC system, or water heater. | 5% - 10% |
| Property Management | Fees paid to a professional company to manage the property, screen tenants, and collect rent. | 8% - 12% |
Don't skip budgeting for these variable costs. Even if you plan to self-manage, budget for a property manager's fee. That way, you know the deal still works if you ever decide to hire one, ensuring your investment remains profitable.
By structuring your modules with this level of detail, your spreadsheet becomes a dynamic tool that empowers you to make smart investment decisions.
Crunching the Numbers That Actually Matter
With your income and expenses meticulously entered, your spreadsheet is ready for its primary function: transforming raw data into actionable intelligence that drives a confident "go" or "no-go" decision.
This is where we move beyond basic bookkeeping to calculate the key performance metrics that define a great rental property.
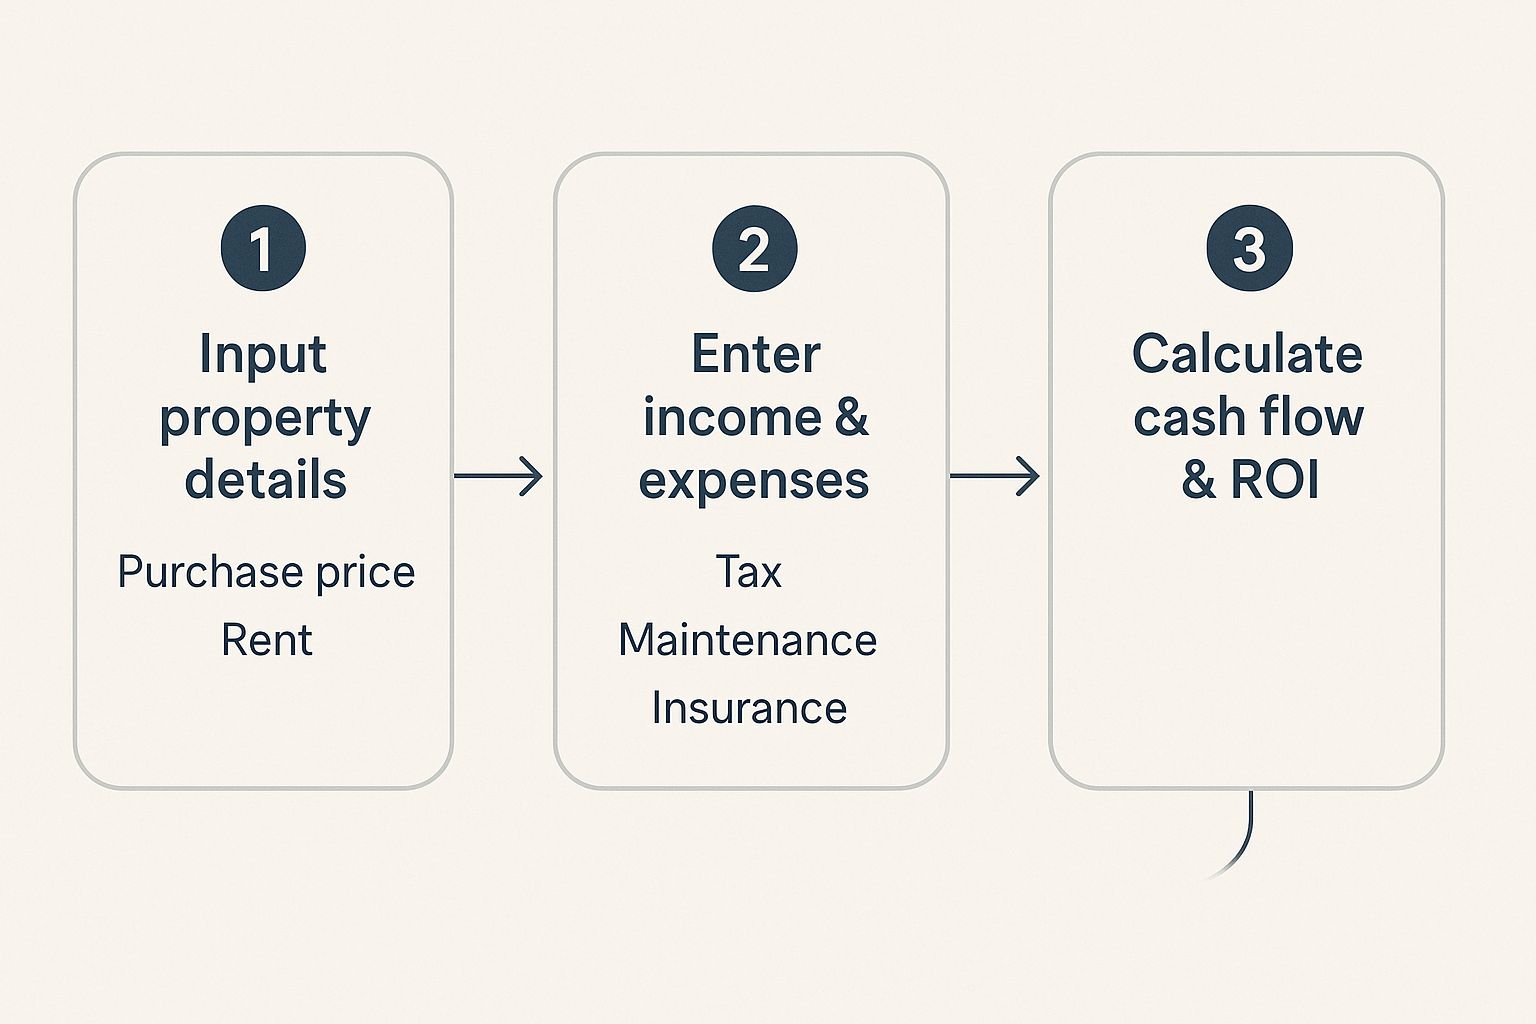
As you can see, reaching an accurate conclusion about a property's potential is a logical flow of information. Let's start with the foundation.
Net Operating Income (NOI)
The most fundamental metric is the Net Operating Income (NOI).
Think of NOI as the property's pure, unleveraged profitability. It reveals how much money the asset generates before considering your mortgage. It's the true measure of the building's operational efficiency.
The formula is simple:
NOI = Gross Operating Income (GOI) - Total Operating Expenses
Your GOI includes all income sources (rent, fees, etc.). Your operating expenses include everything except your mortgage payment. NOI is critical because it allows you to compare different properties on an apples-to-apples basis, irrespective of financing.
Cash Flow: The Bottom Line
While NOI reflects the property's performance, Cash Flow reflects your performance as an investor. This is the tangible, spendable money left in your bank account each month after all bills—including the mortgage—are paid.
Cash flow is the lifeblood of your rental portfolio. To calculate it, simply subtract your total mortgage payment (debt service) from your NOI.
- Monthly Cash Flow:
(NOI / 12) - Monthly Mortgage Payment - Annual Cash Flow:
NOI - Annual Mortgage Payments
Positive cash flow means the property pays for itself and generates profit. Negative cash flow means you are subsidizing the property from your own pocket each month. The goal is always positive.
Capitalization (Cap) Rate for Market Comparison
The Capitalization Rate (Cap Rate) is a powerful tool for quickly comparing investment opportunities, especially across different neighborhoods or cities.
It expresses the relationship between a property's income and its price.
Cap Rate = NOI / Property Purchase Price
A higher Cap Rate generally indicates a higher potential return (and often, higher risk). A lower Cap Rate usually signals a safer, more stable asset. For example, a property with a $12,000 NOI purchased for $200,000 has a 6% Cap Rate. You can use this 6% to instantly compare its value against any other property in your rental property analysis spreadsheet.
Actionable Insight: The Cap Rate is the great equalizer. It cuts through the noise of purchase price and financing to reveal which property is generating the most income relative to its cost.
Cash-on-Cash Return: Your Investment's True Power
Finally, we arrive at the Cash-on-Cash Return. This is arguably the most important personal metric because it answers the ultimate question: How hard is my actual cash working for me?
This metric measures your annual cash flow against the total cash you invested out-of-pocket.
Cash-on-Cash Return = Annual Cash Flow / Total Cash Invested
Your "Total Cash Invested" includes your down payment, all closing costs, and upfront repair expenses. If your property generates $4,000 in annual cash flow from a $50,000 total cash investment, your Cash-on-Cash Return is a solid 8%.
This is the metric that tells you where your capital will achieve the highest velocity. To dive deeper into the calculations behind these key metrics, explore our guide on essential real estate math formulas.
How to Stress-Test Your Investment Scenarios
A profitable analysis on paper is a good start, but building an investment that can withstand real-world challenges is the ultimate goal. This is where your rental property analysis spreadsheet evolves from a calculator into your most powerful risk management tool.
Stress-testing involves playing the pessimist. You ask a series of "what if?" questions to determine how much pressure your deal can handle before it breaks. Instead of relying on your best-guess numbers, you build in variables to see how market shifts could impact your entire financial picture. This is how you move from merely analyzing a deal to truly understanding its resilience.
Building Your 'What-If' Scenarios
Identify the most fragile assumptions in your analysis—the numbers with the greatest potential to negatively impact your bottom line. These are typically vacancy, major repairs, and taxes.
Create a few cells at the top of your sheet for these variables and link your main formulas to them. This allows you to tweak one number and instantly see the effect on your cash flow and returns.
Here are the essential scenarios every investor should model:
- Sudden Vacancy Jumps: Your analysis might use a 5% vacancy rate. What happens if a major local employer downsizes and that rate spikes to 15% for a year? Does your cash flow turn negative?
- The Big-Ticket Repair: Hope for the best, but plan for the worst. A new HVAC system can cost $8,000 or more. Model a large, one-time expense to ensure you have sufficient cash reserves to absorb the hit without being forced to sell.
- Property Tax Shock: Never assume taxes will remain static. Municipalities often reassess properties after a sale. Run a scenario with a 10-20% property tax increase to see how it erodes your monthly profit.
Stress-testing isn’t about expecting the worst; it's about being prepared for it. When you know your investment can survive a tough year, you can stop worrying about market fluctuations and focus on long-term growth.
With the U.S. national vacancy rate at 6.6% and nearly half of all renters being cost-burdened, accounting for these variables is more critical than ever. To dive deeper, you can find more insights on current rental market trends at Resimpli.com.
Looking Beyond Year One: Projecting Long-Term Wealth
Your spreadsheet shouldn't just analyze today's risk; it should also be a tool for mapping out long-term wealth creation. Project how the investment will perform over a 5, 10, or 30-year horizon.
Create a simple table that projects key metrics year-over-year. Be realistic:
- Factor in a conservative annual rent increase, such as 2-3%.
- Assume operating expenses will also rise slightly each year.
- Crucially, track your loan amortization.
This last point reveals the power of leverage. Every mortgage payment your tenant makes reduces your loan principal and builds your equity. By modeling this, you see the complete picture—not just monthly cash flow, but the powerful, wealth-building engine of tenants paying down your debt. This turns a simple spreadsheet into a strategic roadmap for your financial future.
Common Questions Answered
As you begin analyzing deals, certain questions inevitably arise. Here are straightforward answers to some of the most common queries from investors.
What’s the Single Most Important Metric I Should Look At?
While many metrics are valuable, most seasoned investors focus on two: Cash Flow and Cash-on-Cash Return.
Cash flow is king. It's the profit you pocket each month after all expenses, including the mortgage, are paid. It determines whether a property can sustain itself or if it will require you to inject your own money.
Cash-on-Cash Return is equally vital because it measures the efficiency of your invested capital. It compares your annual cash flow to the total cash you put into the deal (down payment, closing costs, upfront repairs). This metric is perfect for comparing different properties to see which one provides the best return on your actual dollars invested.
How Can I Get an Accurate Estimate for Repair Costs?
Estimating repairs is a mix of art and science that improves with experience. A reliable starting point is the percentage method, where you allocate a portion of the rent for future expenses.
Here’s a practical breakdown:
- Routine Maintenance: Set aside 5-10% of the gross monthly rent for small, predictable issues like a running toilet, a broken light switch, or a leaky faucet.
- Capital Expenditures (CapEx): Budget an additional5-10% of the rent for major replacements. This is your savings account for a new roof in ten years, a water heater replacement, or a new HVAC system.
For a more precise estimate on a specific property, nothing beats a professional home inspection before you buy. An inspector's report will detail the age and condition of major systems, allowing you to build a much more accurate long-term budget.
Should I Build My Own Spreadsheet or Just Use a Template?
The most effective approach combines both.
Starting with a pre-made template is a great way to get up and running quickly. It shows you what a comprehensive analysis includes without forcing you to reinvent the wheel.
However, the process of building your own spreadsheet is an invaluable education. It forces you to understand what every number means and how all the calculations interact. This deep understanding is difficult to achieve by simply plugging numbers into someone else's model.
My advice: Download a few different templates to study how professionals structure their analysis. Examine their formulas and the metrics they track. Then, use the best ideas to build your own custom rental property analysis spreadsheet. You’ll create a tool perfectly tailored to your strategy and gain a masterclass-level understanding of real estate finance in the process.
Ready to stop guessing and start analyzing deals with confidence? The Flip Smart platform takes the heavy lifting out of property analysis, allowing you to evaluate any property in seconds—not hours. Get instant valuations, rehab cost estimates, and profit projections to make smarter, faster investment decisions. Visit us at https://flipsmrt.com to see how it works.