

There are three standard real estate valuation methods that appraisers use: the sales comparison approach (what similar homes sold for, adjusted for differences), the income capitalization approach (what the property's net income is worth at a market cap rate) and the cost approach (land value plus the depreciated cost to rebuild). Investors add faster tools on top: gross rent multiplier (GRM), price per square foot, discounted cash flow (DCF), automated valuation models (AVMs) and residual land value.
Each method answers a slightly different question, and each one can be badly wrong on the wrong property. Below you will find the formula, a worked example and the main weakness for every approach, then one property valued three ways so you can see how the numbers disagree and how an appraiser reconciles them.
The 3 approaches to value at a glance
- Sales comparison approach: value = adjusted sale prices of recent comparable sales. Used for almost every single-family home and condo, and for estimating ARV on a flip.
- Income capitalization approach: value = net operating income (NOI) / cap rate. Used for rentals, multifamily and commercial property.
- Cost approach: value = land value + replacement cost of the building - depreciation. Used for new construction, unique buildings and insurance.
Appraisers often run more than one approach on the same property, then weigh them in a final step called reconciliation. Investors usually lean on one primary method that matches their exit (resale or rent) and use the others as a sanity check.
1. Sales comparison approach (market approach)
The sales comparison approach values a property by looking at what buyers recently paid for similar properties nearby, then adjusting each sale price for the ways that comp differs from the subject. It is the main method in residential appraisal because it reflects what real buyers actually paid.
The formula
Adjusted comp price = comp sale price + or - adjustments for differences. The indicated value is a weighted average of the adjusted comp prices, with more weight on the comps that needed the fewest and smallest adjustments.
The rule that trips up new investors: you adjust the comp, not the subject. If the comp has something better than the subject (an extra bedroom, more square feet, a pool), you subtract. If the comp is worse, you add.
When appraisers and investors use it
Use it for any property type that trades often enough to produce good comps: single-family homes, townhomes, condos and small multifamily in neighborhoods with owner-occupant buyers. For flippers, this is how you set after repair value (ARV). You pull renovated comps, adjust them to match your subject as it will look after the rehab, and the result is your projected resale price.
Worked example: setting ARV for a flip
Your subject is a dated 3 bed / 2 bath, 1,600 sq ft house. After the planned rehab it will be in renovated condition. You find three renovated sales nearby from the last few months. Assume local adjustment values of $10,000 per bedroom, $12,000 per bathroom and $100 per square foot of living area.
| Item | Comp A | Comp B | Comp C |
|---|---|---|---|
| Sale price | $310,000 | $338,000 | $298,000 |
| Beds / baths | 3 / 2 | 4 / 2 | 3 / 1 |
| Square feet | 1,550 | 1,700 | 1,580 |
| Bedroom adjustment | $0 | -$10,000 | $0 |
| Bathroom adjustment | $0 | $0 | +$12,000 |
| Size adjustment | +$5,000 (50 sq ft x $100) | -$10,000 (100 sq ft x $100) | +$2,000 (20 sq ft x $100) |
| Adjusted price | $315,000 | $318,000 | $312,000 |
The three adjusted prices land within $6,000 of each other, which is a good sign. A simple average is ($315,000 + $318,000 + $312,000) / 3 = $315,000 ARV. Comp A needed the smallest adjustments, so if the spread were wider you would lean toward its number.
A condition adjustment works the same way. If one comp had sold unrenovated, you would add the value gap between dated and renovated condition in that market. Unrenovated sales make weak ARV comps, though, because that gap is the hardest number to pin down.
From ARV you get your offer ceiling. With $45,000 of repairs: MAO = ($315,000 x 0.70) - $45,000 = $220,500 - $45,000 = $175,500.
Main weakness
It depends entirely on comp quality. In rural areas, slow markets or for unusual homes you may find only one or two usable sales, and every adjustment you make is a judgment call. If that is your situation, see how to estimate ARV when you only find one or two good sales. Comps are also backward-looking, so in a shifting market even recent sales can lag current prices.
2. Income capitalization approach
The income approach values a property by what it earns. You estimate the net operating income a typical buyer would expect, then divide by the cap rate that similar properties are trading at. Buyers of income property are buying a stream of cash, and this method prices that stream.

The formula
Value = NOI / cap rate. NOI is gross rent minus vacancy and operating expenses (taxes, insurance, repairs, management, reserves). NOI excludes mortgage payments, because the value of the building should not depend on how a particular buyer finances it.
When appraisers and investors use it
Appraisers rely on it for apartment buildings, retail, office and industrial property, and they often include it for 2 to 4 unit residential. Rental and BRRRR investors use it to check whether the price makes sense on income alone, regardless of what the house next door sold for.
Worked example: a fourplex
- Gross scheduled rent: 4 units x $1,250 x 12 = $60,000
- Vacancy and credit loss at 6%: -$3,600
- Effective gross income: $56,400
- Operating expenses: -$22,400
- NOI: $34,000
If similar fourplexes in the area trade at a 7% cap rate, value = $34,000 / 0.07 = $485,714, call it $486,000.
Main weakness
The result is very sensitive to two inputs that are easy to fudge. Move the cap rate from 7% to 7.5% and the same NOI is worth $34,000 / 0.075 = $453,333, a drop of more than $32,000. Understate expenses and NOI rises, which inflates value directly. Before you trust a seller's NOI, rebuild it yourself using a realistic expense stack from rent to NOI, and check what counts as a good cap rate for the asset and market.
3. Cost approach (replacement cost method)
The cost approach asks what it would cost to buy the land and build an equivalent building today, then subtracts for the wear and obsolescence of the existing one. The logic is that an informed buyer will not pay more for an existing building than the cost of building a new substitute.
The formula
Value = land value + replacement cost of improvements - depreciation. Depreciation has three parts: physical (wear and tear), functional (outdated layout or systems) and external (problems outside the property, such as a new highway next door).
When appraisers and investors use it
It carries the most weight on new or nearly new construction, on special-purpose buildings with no real comps or rent (schools, churches, custom homes) and for insurance replacement values. Investors use it to sanity-check a price that looks high relative to building costs, or to decide whether building new beats buying existing.
Worked example: a 10-year-old house
- Land value (from vacant lot sales): $80,000
- Replacement cost: 2,000 sq ft x $175 per sq ft = $350,000
- Physical depreciation: 10 years of an estimated 50-year life = 20% x $350,000 = -$70,000
- Functional and external obsolescence: none observed
- Value: $80,000 + $350,000 - $70,000 = $360,000
Main weakness
Depreciation on an older building is a judgment call, and the method ignores demand. A house can cost $360,000 to replace and still only sell for $300,000 if buyers in that neighborhood will not pay more. That is why it gets little weight on older homes in active resale markets.
One property, three valuations: how appraisers reconcile them
Here is a hypothetical 1995 duplex, two units of 1,200 sq ft each, in a neighborhood where both investors and owner-occupants buy. Each approach gives a different number.
- Sales comparison: three recent duplex sales adjust to $340,000, $352,000 and $346,000. Indicated value: $346,000.
- Income: rent of $1,550 x 2 units x 12 = $37,200. Less 5% vacancy ($1,860) = $35,340. Less $12,840 of expenses = NOI of $22,500. At a 6.75% market cap rate, $22,500 / 0.0675 = $333,333.
- Cost: land $70,000. Replacement cost 2,400 sq ft x $150 = $360,000. The building has been updated, so its effective age is 20 years of a 60-year life, or one-third depreciation: -$120,000. Indicated value: $70,000 + $360,000 - $120,000 = $310,000.
| Approach | Indicated value | Weight | Weighted value |
|---|---|---|---|
| Sales comparison | $346,000 | 50% | $173,000 |
| Income | $333,333 | 40% | $133,333 |
| Cost | $310,000 | 10% | $31,000 |
| Reconciled value | about $337,000 |
Reconciliation is not a mechanical average. The appraiser asks which approach has the best data and best reflects how buyers of this property think. Here the duplex comps are close and recent, so sales comparison gets the most weight. Investors buy duplexes for income, so the income approach gets real weight too. The building is 30 years old, so the cost approach, with its big depreciation guess, gets little.
The investor takeaway: the approaches disagree for a reason. A $13,000 gap between sales comparison and income here tells you owner-occupants are paying a bit more than the rent justifies. If you are buying to hold, the income value ($333,000) is your real ceiling, not the comps.
Investor shortcuts: GRM, price per square foot, DCF, AVMs and residual land value
The three appraisal approaches take time. Investors screen dozens of properties before one deserves a full analysis, so these faster methods do the first pass.
Gross rent multiplier (GRM)
GRM = price / gross annual rent, and value = gross annual rent x market GRM. Take three duplex sales: $340,000 with $36,000 of rent (GRM 9.44), $360,000 with $37,500 (9.60) and $330,000 with $35,000 (9.43). The average is about 9.5. The duplex above, at $37,200 of rent, screens at $37,200 x 9.5 = $353,400.
The weakness is that GRM ignores expenses. Two buildings with the same rent can have very different taxes, utilities paid by the owner or repair needs, so a building can look cheap on GRM and still lose money. Use it only to decide what deserves a full NOI analysis. More in our guide to gross rent multiplier.
Price per square foot (and why it misleads)
Value = subject square footage x average price per square foot of comps. It is quick, and it is one of the most common ways investors overpay.
Say one comp is 1,000 sq ft and sold for $230,000 ($230 per sq ft) and another is 2,000 sq ft and sold for $380,000 ($190 per sq ft). Averaging gives $210 per sq ft, so a 1,500 sq ft subject "should" be worth $315,000. But price per square foot falls as size rises, because every house carries the same fixed costs for a kitchen, bathrooms, a roof and a lot. The averaged number hides condition, layout, bedroom count and location within the neighborhood. We break down the problem and the fix in why price per square foot lies about ARV.
Discounted cash flow (DCF)
DCF values a property as the present value of its future cash flows plus its future sale price. Value = sum of [cash flow in year t / (1 + r)^t] + [sale price at exit / (1 + r)^n], where r is your required return and n is the hold period.
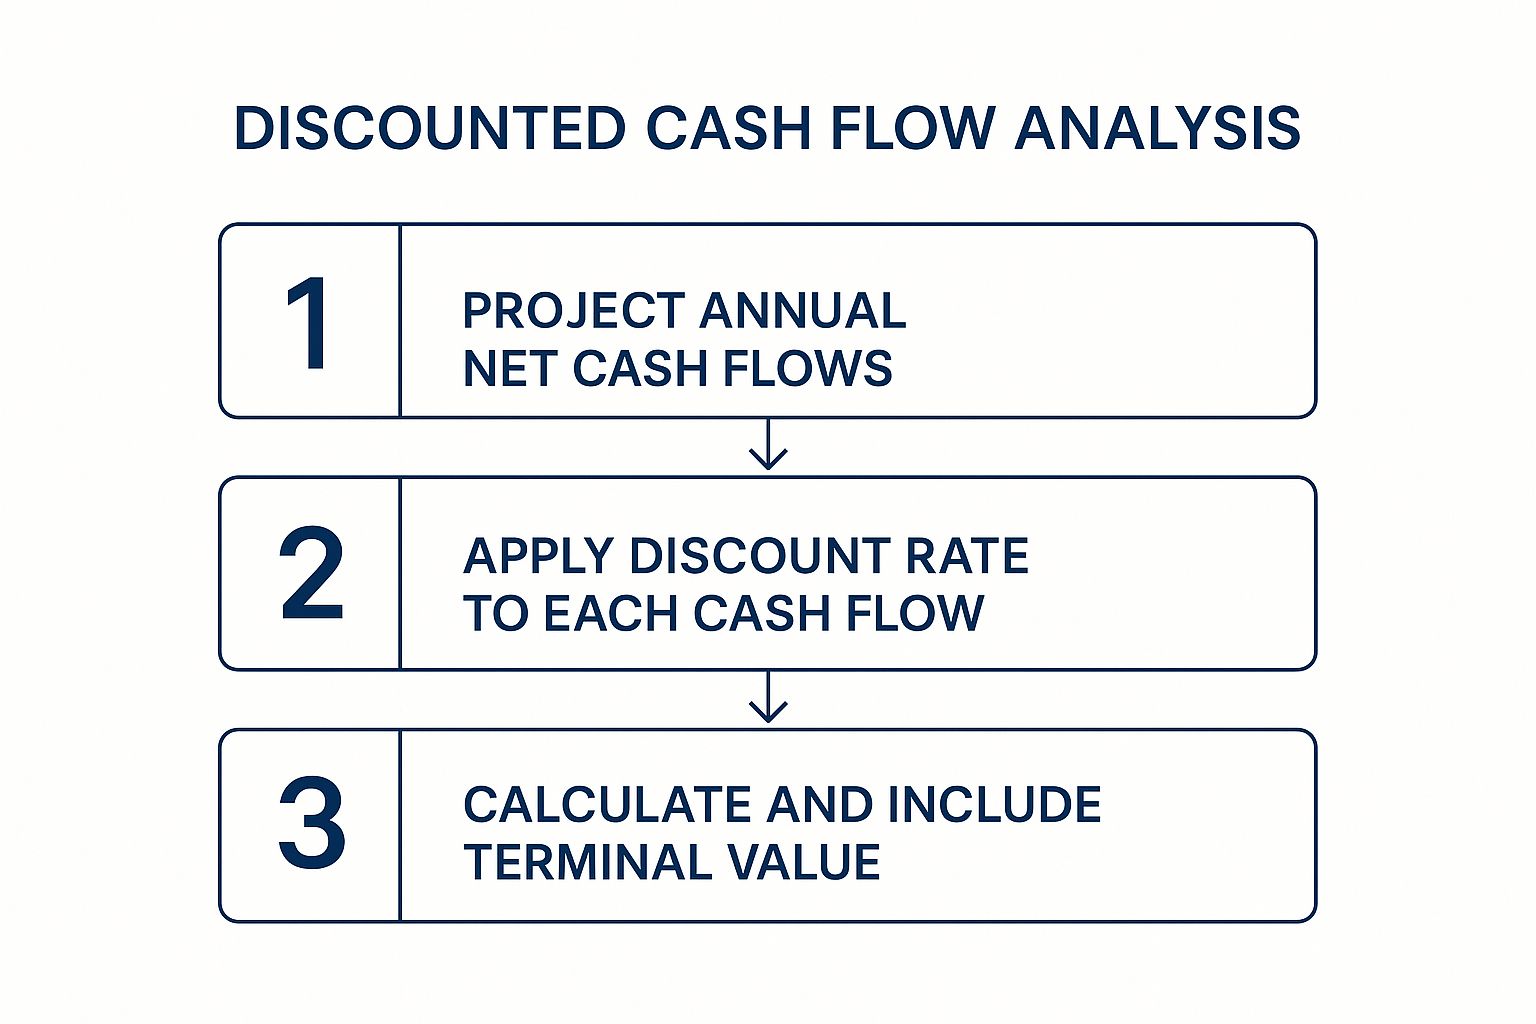
Take the fourplex from earlier: NOI of $34,000 growing 3% a year, a 5-year hold, a 9% discount rate and a sale at a 7.5% cap rate on year 6 NOI.
- NOI years 1 to 5: $34,000, $35,020, $36,071, $37,153, $38,267
- Present value of those five years at 9%: about $139,710
- Sale price: year 6 NOI of $39,415 / 0.075 = about $525,540
- Present value of the sale: $525,540 / 1.09^5 = about $341,560
- DCF value: about $481,270
The weakness: small changes in the growth rate, discount rate or exit cap rate swing the answer a lot, and you are forecasting five or more years out. DCF is most useful when income will change over the hold (lease-up, a value-add renovation, leases rolling over). To build one yourself, see how to build a discounted cash flow model in Excel.
Automated valuation models (AVMs)
An AVM is an algorithm that estimates value from public records, listing data and recent sales. Zillow's Zestimate and the estimates on Redfin and Realtor.com are the familiar examples, and lenders use their own versions.
AVMs are useful for a free, fast starting point on any address. Their limits matter for investors, though. An AVM usually does not know the property's actual condition, so it can value a gutted house like its renovated neighbors, or miss a renovation that never got permitted. Estimates for the same address often differ between sites, and they are weakest on unusual homes and in areas with few sales. Treat an AVM as a prompt to pull your own comps, never as ARV.
Residual land value
Residual land value works backward from a finished project to what you can afford to pay for the land. Land value = gross development value - hard costs - soft costs - financing costs - required developer profit.
Example: a lot can hold four townhomes that would sell for $425,000 each, a gross development value of $1,700,000. Subtract hard costs of $880,000, soft costs (design, permits, fees) of $120,000, financing of $70,000 and a 15% profit target of $255,000. The residual is $1,700,000 - $880,000 - $120,000 - $70,000 - $255,000 = $375,000 for the land.
The weakness is leverage. If sale prices come in 5% lower ($85,000 less), the land is worth $85,000 less, a cut of nearly a quarter. Builders, infill developers and anyone buying a teardown use it, but only with conservative sale prices.
Commercial real estate valuation methods
Commercial property (apartment buildings of 5+ units, retail, office, industrial, self-storage) is valued mostly with the income approach. Buyers are pricing the income stream, and comparable sales are used mainly to find market cap rates rather than to compare price directly.
- NOI is the foundation. Appraisers and lenders build NOI from the rent roll and operating statements, then normalize it: market vacancy, a management fee even if the owner self-manages and replacement reserves. Lease structure matters a lot. Under a triple net (NNN) lease the tenant pays taxes, insurance and maintenance, so the owner's expenses and NOI look very different from a gross lease.
- Cap rates come from the market. The appraiser derives a cap rate from recent sales of similar assets (cap rate = NOI / price), then applies it. A small strip center with $180,000 of NOI at a 7.25% cap rate is worth $180,000 / 0.0725 = about $2,482,760. Cap rates vary by asset type, tenant credit, lease length and location.
- DCF for multi-year holds. When leases expire at different times, rents are below market or a renovation is planned, a single year of NOI does not tell the story. Institutional buyers and appraisers of larger assets model 5 to 10 years of cash flow with a DCF and a terminal sale price.
- Sales comparison as a check. Price per unit (multifamily), price per square foot (office, retail, industrial) and price per room (hotels) are compared with recent trades, but they rarely drive the final number.
The cost approach is used for new or special-purpose commercial buildings and for insurance. Residual land value shows up on development sites.
Which valuation method should you use?
Match the method to how the property will be bought and sold, then confirm with a second method.
| Method | Best for | Data needed | Main weakness |
|---|---|---|---|
| Sales comparison | Single-family, condos, flip ARV | Recent nearby sold comps, property details, adjustment values | Thin or stale comps; subjective adjustments |
| Income capitalization | Rentals, multifamily, commercial | Rents, vacancy, operating expenses, market cap rates | Very sensitive to cap rate and expense assumptions |
| Cost approach | New construction, unique buildings, insurance | Land sales, construction costs, depreciation estimate | Ignores demand; depreciation is a guess on older buildings |
| Gross rent multiplier | Quick screening of small rentals | Gross rents and sale prices of similar rentals | Ignores expenses |
| Price per square foot | Rough ballpark only | Sale prices and square footage | Hides size, condition, layout and location differences |
| Discounted cash flow | Multi-year holds, value-add, commercial | Multi-year income forecast, discount rate, exit cap rate | Small input changes swing value a lot |
| AVM | Free starting point on any address | An address | Does not know condition; weak on unusual homes |
| Residual land value | Land, teardowns, development | Finished sale prices, build costs, profit target | Small sale price changes swing land value heavily |
For a flip, sales comparison sets ARV and everything else is a cross-check. For a buy-and-hold, run both sales comparison and income, and let the lower number cap your offer.
Frequently asked questions
What is the most accurate property valuation method?
No single method is the most accurate for every property. For houses in neighborhoods with regular sales, the sales comparison approach using recent, nearby, adjusted comps is the most reliable, because it reflects what buyers actually paid. For income property the income approach is more reliable, and for new or one-of-a-kind buildings the cost approach can be. Accuracy comes from good data and running a second method as a check.
What are the 3 approaches to value in real estate?
The three approaches to value are the sales comparison approach, the income capitalization approach and the cost approach. Sales comparison adjusts recent comparable sales, income divides NOI by a market cap rate, and cost adds land value to the depreciated cost of rebuilding. Appraisers reconcile the results into one final value.
How do appraisers value a house?
For a typical single-family home, an appraiser inspects the property, selects recent comparable sales nearby and adjusts each comp's price for differences such as size, bedrooms, bathrooms, condition, lot and location. The adjusted comps produce the indicated value. The cost approach may be added for newer homes, and the income approach for small rentals, before a final reconciliation.
What are the valuation methods for commercial real estate?
Commercial real estate is valued mainly with the income approach: NOI divided by a market cap rate, or a discounted cash flow for multi-year holds with changing income. Sales comparison is used to derive cap rates and as a check on price per unit or per square foot. The cost approach applies to new or special-purpose buildings.
Is a Zestimate an accurate way to value a property?
A Zestimate or other AVM is a useful starting point, but it is not an appraisal. It usually does not know the home's interior condition or recent renovations, and estimates often differ between sites for the same address. Investors should pull and adjust their own comps before making an offer.
What is the difference between appraisal methods and investor valuation techniques?
Appraisal methods are the three formal approaches lenders rely on, documented in a standardized report. Investor techniques like GRM, price per square foot and quick ARV estimates are faster screens used to decide whether a property deserves a full analysis. Serious investors use both: shortcuts to filter, then the formal approaches before committing money.
Get a sales comparison ARV on a real deal. FlipSmrt's ARV is built on the sales comparison approach: it pulls recent sold comps near the property, adjusts them for differences, prices the rehab line by line and gives you ARV, MAO and a go/no-go verdict in under 5 minutes. Analyze a property free (your first 3 analyses are free).