You’ve seen the TV shows. The ones where flippers breeze through a renovation and walk away with a six-figure check. It looks almost too easy.
But what does the average profit from flipping houses look like in the real world, away from the camera crews? The numbers are more grounded, but the opportunity for substantial profit is very real—if you know what you’re doing. This guide will walk you through how the pros calculate profit, the key factors that can make or break your deal, and how to avoid the common pitfalls that trip up new investors.
Decoding the National Average Profit
Before you can figure out what your deal might make, it helps to have a national benchmark. Think of it like the sticker price on a car—it’s a solid starting point, but the final price depends on a dozen other factors.
Recent market data shows a clear trend of profit compression, a fancy way of saying margins are getting tighter. According to analysis from industry leaders like ATTOM Data Solutions, the typical U.S. house flip in the first half of 2025 generated a gross profit of around $65,000.
This works out to a gross return on investment (ROI) of about 25.1%, which is one of the leaner margins we’ve seen since the 2008 housing crisis.
To give you a clearer picture, here's a quick summary of those key national benchmarks.
National House Flipping Averages at a Glance
| Metric | Typical Figure (Recent Data) | What It Means For You |
|---|---|---|
| Gross Profit | $65,000 | This is the difference between sale price and purchase price. It’s your starting point before any expenses. |
| Gross ROI | 25.1% | Your gross profit as a percentage of your initial purchase price. A useful but incomplete measure. |
These numbers provide a great 30,000-foot view, but they don't tell the whole story. The most important distinction to make is between "gross" and "net."
Gross Profit vs. Your Actual Take-Home (Net Profit)
That $65,000 figure is what we call gross profit. It’s the simple math: Sale Price - Purchase Price. It’s an exciting number, for sure, but it’s not what ends up in your bank account.
Quick Takeaway: Your real success in flipping is measured by net profit—the money left in your pocket after all expenses are paid. This includes renovation, closing costs, financing, and more.
Ignoring these other costs is the single fastest way to watch a "profitable" deal turn into a financial nightmare.
Why Averages Are Just the Beginning
The national average is just one piece of a much larger puzzle. Profitability can swing wildly depending on a few key variables that every experienced investor obsesses over:
- Location, Location, Location: It’s a cliché for a reason. A flip in San Diego will have completely different numbers—purchase price, rehab costs, and final sale price—than one in suburban Ohio.
- Property Condition: This is your rehab budget. A house needing simple cosmetic fixes like paint and carpet is a world away from one that needs a new foundation, roof, and electrical system.
- Market Dynamics: Are you selling in a hot seller's market where buyers are bidding over asking? Or is the market cooling, forcing you to drop your price? Timing is everything.
Understanding these factors is how you move from staring at national averages to accurately projecting the profit on a specific deal. Seeing real-world examples can make this much clearer; check out our gallery of stunning before and after house flips to see how different projects and budgets pan out.
How to Accurately Calculate Your Potential Profit
When you're flipping houses, the difference between what you sell a home for and what you bought it for is just a tiny piece of the story. That number is your "gross profit," and while it might look impressive on a napkin, it's a vanity metric that can get you into a lot of trouble.
To actually understand what you'll walk away with, you need to master the full net profit formula. Think of it as the financial GPS for your entire project—without it, you're just guessing.
The Five Core Elements of Your Profit Formula
Every successful flip is built on a clear understanding of five key numbers. These are the inputs that reveal your true net profit, the only number that actually matters.
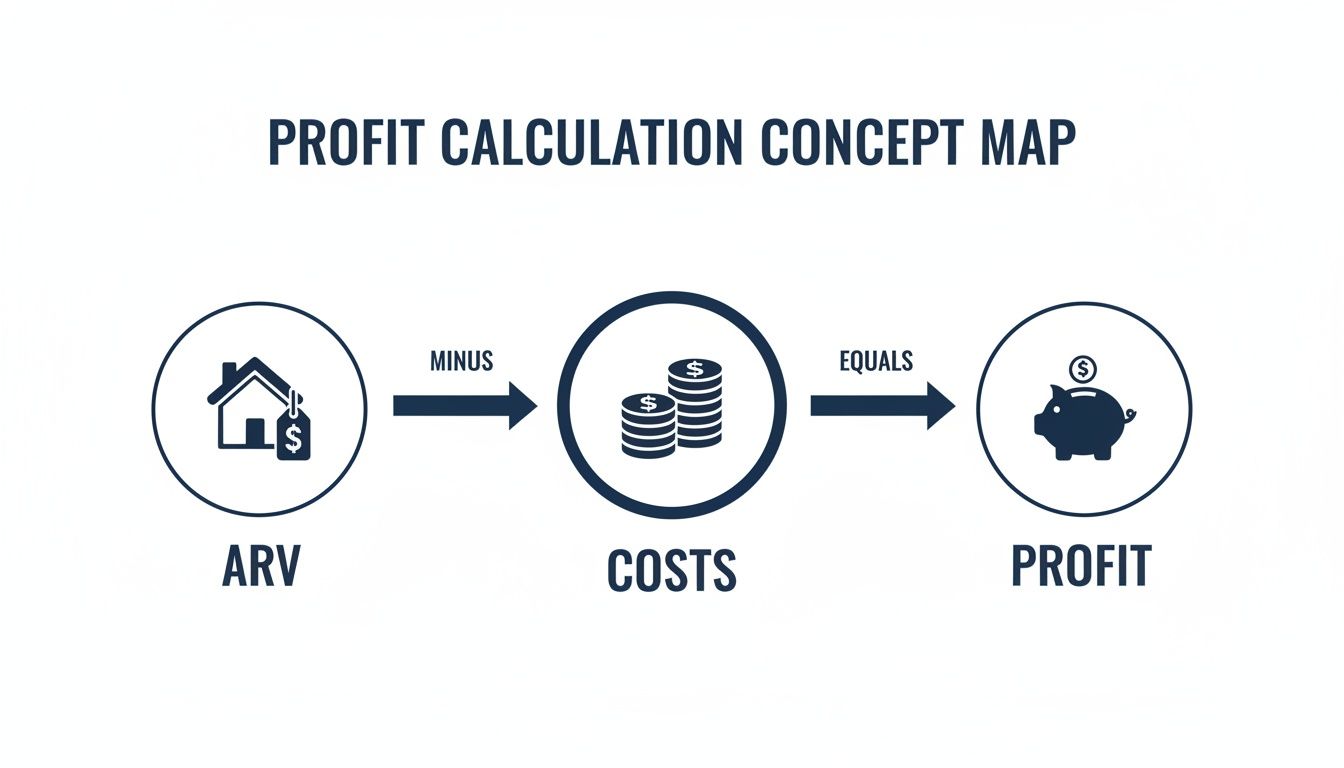
Here’s the formula that should be etched into every flipper's brain:
ARV - Purchase Price - Rehab Costs - Holding Costs - Selling Costs = Net Profit
Let's quickly break down what each of these means in plain English.
After Repair Value (ARV): This is the north star for your entire deal. It's the estimated price you can realistically sell the property for after all your hard work is done and the home is in top market condition.
Purchase Price: Simple enough—this is the price you pay to get the keys to the property.
Rehab Costs: This bucket includes every single dollar spent on the renovation. We're talking about everything from a new roof down to the last light switch. A huge part of this is often the cost of painting a house, as it's a core expense on nearly every project.
Holding Costs: These are the quiet killers of profit. For every single day you own that property, the meter is running on expenses like loan payments, property taxes, insurance, and utilities.
Selling Costs: Once you find a buyer, you still have to pay to play. This includes real estate agent commissions, closing costs, and any transfer taxes required to get the deal done.
Putting the Formula into Action with an Example
Theory is one thing, but let's run the numbers to see how that big, exciting gross profit number shrinks into a realistic net profit.
Imagine you've found a potential flip:
- Purchase Price:$200,000
- Estimated After Repair Value (ARV):$350,000
A quick glance suggests a $150,000 gross profit. Awesome, right? Not so fast. Now we have to factor in reality.
Key Takeaway: Gross profit is for dreamers; net profit is for business owners. Never, ever make a decision until you've calculated all five parts of the profit formula.
Let’s plug in the rest of the costs for our example:
- Rehab Costs: You've budgeted $60,000 to tackle a new kitchen, update the bathrooms, and install fresh flooring and paint.
- Holding Costs: You project a six-month timeline, estimating $9,000 in loan payments, taxes, and insurance.
- Selling Costs: You anticipate $21,000 for agent commissions (usually 5-6% of the ARV) and other seller-paid closing costs.
Now, let's run the full formula again:
$350,000 (ARV) - $200,000 (Purchase) - $60,000 (Rehab) - $9,000 (Holding) - $21,000 (Selling) = $60,000 Net Profit
That flashy $150,000 profit just became a much more sober $60,000 in your bank account. This is the real number that determines if a deal is worth your time and risk.
To run these numbers quickly and accurately on any property you're looking at, a professional fix and flip calculator is an indispensable tool.
The 5 Key Factors That Make or Break Your Flip
Ever wondered why one investor walks away with a six-figure check while another barely breaks even on a nearly identical house down the street? It's not luck. The difference comes down to mastering five critical variables that dictate your profit on every single deal.
Getting these right is what separates a real flipping business from a very expensive hobby. Each one is a lever you can pull to protect your bottom line and steer the project toward a successful payday.
Think of it this way: your final sale price is your total revenue. Everything else is a cost chipping away at it.
As you can see, the path to profit starts with a solid After Repair Value (ARV) and ends with aggressively managing every dollar that goes out. Let's break down the five cost centers you absolutely have to nail.
1. The Purchase Price
Here’s the oldest saying in real estate investing, because it’s the truest: you make your money when you buy, not when you sell. Overpaying is the one mistake you can almost never recover from, no matter how perfect the renovation or how hot the market gets.
This is where a battle-tested guideline like the 70% Rule becomes your best friend.
The 70% Rule Explained: This rule of thumb says you should pay no more than 70% of the property's After Repair Value (ARV), minus the estimated repair costs. If a house should be worth $300,000 after renovations and needs $40,000 of work, your maximum offer is $170,000.
($300,000 ARV x 0.70) - $40,000 Repairs = $170,000 MAO (Maximum Allowable Offer)
Following this formula bakes a crucial 30% margin into the deal from day one. That buffer is there to cover your financing, closing costs, profit, and any nasty surprises.
2. Renovation Costs
Your rehab budget is the most common place a profitable deal goes completely off the rails. The secret is to renovate for your target buyer, not for your own HGTV-inspired dreams. You need to make smart, strategic upgrades that add real value without over-improving for the neighborhood.
For instance, knowing the impact of strategic flooring choices on a home's value is a perfect example of focusing on high-ROI improvements that buyers notice.
- Focus on High-Impact Zones: Kitchens and bathrooms sell houses. Period. Put your money where it matters most.
- Nail the Curb Appeal: First impressions are everything. Fresh paint, simple landscaping, and a new front door can add thousands in perceived value for a relatively small investment.
- Always Have a Contingency: Things will go wrong. Budget a 10-15% contingency from the start for the inevitable surprises, like a rotted subfloor under the toilet or an ancient electrical panel that won't pass inspection.
3. Holding and Financing Costs
Imagine a taxi meter running in the background of your project, 24/7. That's what holding costs are. Every single day you own that property, you're bleeding cash that eats directly into your profit.
These relentless costs typically include:
- Loan payments (especially high with hard money)
- Property taxes
- Homeowner's insurance
- Utilities (power, water, gas)
With the average flip now taking 166 days to complete, these carrying costs have become a massive factor. While a surprising 62-63% of flips are still bought with cash, for everyone else, rising interest rates are squeezing margins thin. For a deeper dive, check out our guide on how to calculate holding costs so you're never caught off guard.
4. Selling Costs
You’ve survived the renovation, the house looks incredible, and you’re ready to cash in. Not so fast. Getting from "listed" to "sold" comes with a final round of significant expenses you have to account for.
These closing costs typically add up to 6-9% of the final sale price and include:
- Real Estate Agent Commissions: Usually 5-6% of the sale price.
- Seller Concessions: Buyers might ask for credits to cover their closing costs or a last-minute repair.
- Closing Costs: Title insurance, escrow fees, and transfer taxes can easily tack on another 1-3%.
On a $350,000 sale, that's $20,000-$25,000 right off the top. If you don't budget for this from the beginning, the final settlement statement will be a painful surprise.
5. Market Conditions
The last factor is the big one you can't control: the market itself. A sudden spike in interest rates, a flood of new listings in the neighborhood, or a dip in buyer confidence can all change the game overnight. This affects both your final sale price and how long the property sits on the market racking up those holding costs.
You can't predict the future, but you can prepare for it. Smart investors mitigate this risk by buying right, renovating efficiently to keep their timeline short, and staying obsessed with local market data. Your ARV projections must be based on what's happening today, not on wishful thinking from six months ago.
Two Real-World Flip Scenarios: A Success and a Failure
Theory is great, but seeing the numbers play out in the real world is where the most valuable lessons are hiding. Let's put everything we've talked about into practice by walking through two detailed, side-by-side case studies.
In one, an investor nails the process and walks away with a healthy profit that makes all the hard work worth it. In the other, a series of common—but costly—missteps turns a promising project into a break-even nightmare. These scenarios will show you exactly how decisions on the ground can make or break your profit.

Scenario A: The Perfect Flip
Meet Sarah, an investor who found an undervalued property in a solid neighborhood. The house had "good bones" but was cosmetically stuck in the 90s, making it the perfect candidate for a strategic facelift.
Sarah did her homework. She ran the comps to establish a conservative After Repair Value (ARV) and stuck to the 70% Rule like glue when she made her offer. Her rehab plan was detailed down to the last light fixture, her contractor was vetted, and she had a contingency fund ready just in case.
Because of her meticulous planning, the project ran like clockwork. The renovation finished on time and on budget, and she listed the property right as the spring buying season kicked into high gear. The house sold in under two weeks for her full asking price.
Scenario B: The Break-Even Nightmare
Now for Mark. He found a property that seemed like a steal and, caught up in the excitement of a potential deal, paid a little more than his numbers told him to. He figured he could make up the difference with a fast, cheap renovation. Famous last words.
His problems started almost immediately. The "cheap" contractor he hired was unreliable, causing massive delays. During demolition, they discovered a major plumbing leak hidden behind a wall and some old electrical wiring that wasn't up to code. These surprises completely torched his already-thin rehab budget.
The project dragged on for seven months instead of the planned four. By the time he finally listed it, the local market had cooled off a bit. After three painful price drops, he accepted an offer that just barely covered his total costs, leaving him with virtually no profit to show for over half a year of stress.
Key Insight: The difference between profit and loss is rarely one single catastrophe. It's usually a series of small, compounding errors—overpaying by a little, under-budgeting for repairs, and letting the timeline slip.
Case Study Comparison: The Perfect Flip vs. The Break-Even Nightmare
Seeing the numbers side-by-side reveals exactly where Mark's deal went off the rails and how Sarah protected her profit margin every step of the way.
| Financial Item | Scenario A: Perfect Flip | Scenario B: Break-Even Nightmare |
|---|---|---|
| Purchase Price | $210,000 (Followed 70% Rule) | $225,000 (Overpaid by $15k) |
| After Repair Value (ARV) | $350,000 | $350,000 |
| Initial Rehab Budget | $50,000 | $45,000 |
| Unexpected Repairs | $0 (Covered by contingency) | $15,000 (Plumbing & Electrical) |
| Actual Total Rehab Cost | $50,000 | $60,000 |
| Project Timeline | 4 Months | 7 Months |
| Total Holding Costs | $8,000 | $14,000 (3 extra months) |
| Final Sale Price | $350,000 | $325,000 (Due to market shift) |
| Selling Costs (8%) | $28,000 | $26,000 |
| Gross Profit (Sale - Purchase) | $140,000 | $100,000 |
| Total Expenses | $86,000 | $100,000 |
| FINAL NET PROFIT | $54,000 | $0 |
As the table clearly shows, Sarah's discipline during the purchase phase gave her a crucial financial buffer from day one. Her realistic rehab budget and tight timeline kept costs exactly where they needed to be.
Mark, on the other hand, started in the red by overpaying. That initial mistake was then magnified by an underestimated rehab budget and crippling holding costs from the extended timeline. This comparison isn't just a hypothetical exercise; it's a perfect illustration of why your upfront analysis is the single most important factor in determining your final profit.
Analyze Any Flip in Minutes, Not Hours
After seeing how dozens of variables can demolish the average profit on a house flip, the thought of wrestling with a spreadsheet is enough to give anyone a headache. A single bad formula or one overly optimistic guess can turn a promising deal into a financial nightmare. This is exactly where modern analysis tools step in, closing the gap between tedious manual math and fast, data-driven decisions.
Instead of fighting with formulas, platforms like Flip Smart are built to do the heavy lifting for you. You can go from finding a potential property to seeing a full profit projection in just a few minutes. Not hours.
From Guesswork to Data-Driven Decisions
The old way of flipping meant spending hours on the phone with contractors for ballpark estimates and digging through public records for comps. It was slow, frustrating, and often inaccurate. Today's tools replace all that guesswork with instant, localized data.
Instead of guessing your rehab budget, these platforms provide detailed estimates based on the property’s size, age, and regional material and labor costs. Rather than struggling to project your holding costs, the software models everything for you, factoring in local taxes, insurance, and typical financing rates.
This screenshot from Flip Smart shows how it boils down a complex analysis into a clear, actionable dashboard.
The dashboard instantly spits out the key metrics you need: After Repair Value (ARV), total estimated costs, and your potential profit. It turns a mountain of calculations into an easy-to-read summary.
The Modern Flipper's Edge: The goal isn't just to analyze deals faster—it's to analyze them better. By automating the tedious parts of due diligence, you can pour your energy into negotiating and executing the project, which is where your skills truly make a difference.
Stress-Test Your Deal with Sensitivity Analysis
Maybe the single most powerful feature of a modern analysis tool is the ability to run a sensitivity analysis. This is where you get to play "what if" and see how your profit holds up under pressure.
What happens if the renovation costs come in 15% over budget? What if the house sits on the market for an extra three months? Or what if you have to drop your price and accept an offer that's $20,000 below your target ARV?
With just a few clicks, you can see exactly how those scenarios wreck—or don't wreck—your bottom line. It lets you model the best-case, worst-case, and most-likely outcomes, giving you a clear-eyed view of the risks before you ever commit a dollar.
This is your financial safety net. It's how you spot the deals with a strong profit buffer and sidestep those "break-even nightmares" that look good on paper but are secretly built on a house of cards. This is how you apply the lessons in this guide quickly and accurately to every single deal you look at.
Frequently Asked Questions
What is a good profit margin on a house flip?
While it varies by market, most experienced investors aim for a net profit of 10-20% of the home's After Repair Value (ARV). On a house projected to sell for $350,000, that translates to a target net profit of $35,000 to $70,000. This margin ensures the potential reward is worth the time, risk, and capital involved.
What is the biggest financial mistake new flippers make?
The most common and costly mistake is underestimating the renovation budget. New investors often create a best-case-scenario budget and get blindsided by unexpected issues like outdated wiring or hidden water damage. A very close second is overpaying for the property at the start, which makes it nearly impossible to turn a profit, no matter how well the renovation goes.
How long does it typically take to flip a house?
You should plan for a project to take around six months from the day you purchase the property to the day you close the sale. The national average is currently between 160-180 days. This timeline includes finding and closing on the property, completing the renovation, listing the home, and waiting for your buyer's financing to be approved.
Ready to stop guessing and start analyzing deals like a pro? Flip Smart gives you the power to calculate ARV, estimate rehab costs, and project your net profit in minutes, not hours. Analyze your first deal for free today at flipsmrt.com and make your next investment your most profitable one.