
Why the Right Neighborhood Matters for Flipping Success
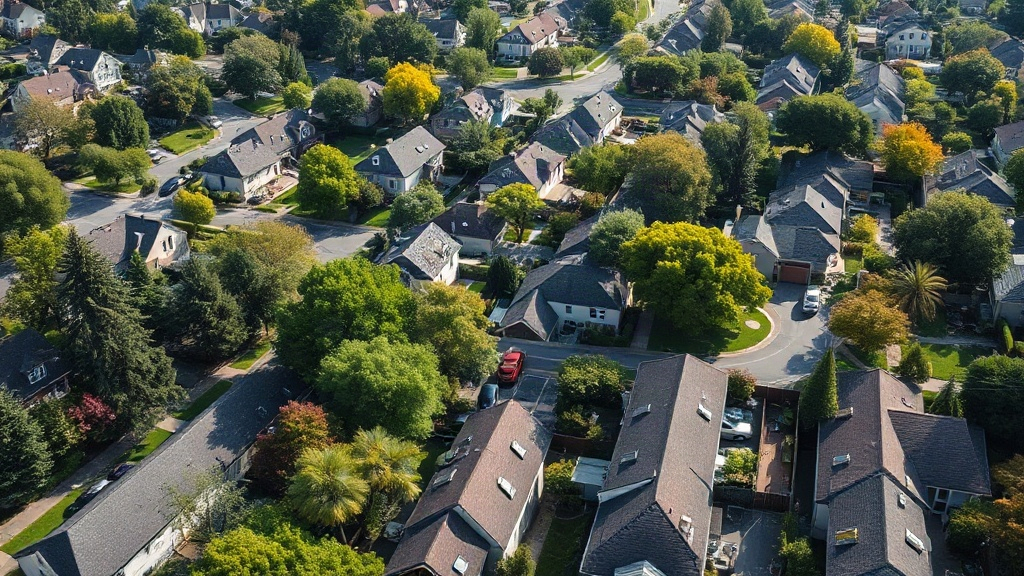
Choosing the right neighborhood can make or break a fix-and-flip project. A property’s profitability isn’t determined by its purchase price alone. The neighborhood directly impacts how much you can sell the property for after renovations, how quickly it will sell, and the type of buyers you’ll attract. Focusing on a market with strong demand and favorable trends is essential to avoid holding costs and maximize your return.
Want to skip the spreadsheet? FlipSmrt pulls comps, estimates ARV and rehab, and runs the deal math from just an address. Try your first analysis free.
One key factor is buyer demand. Look for neighborhoods with low inventory and high turnover rates, as these indicate a strong pool of potential buyers. For example, if a neighborhood has an average days-on-market of 20-30 days and homes consistently sell near or above the asking price, it’s a sign that demand is healthy. On the flip side, areas with stagnant listings or price reductions are a risk, as you may struggle to sell your flip quickly.
Market trends also play a significant role. Neighborhoods experiencing growth—whether through new developments, infrastructure projects, or an influx of businesses—often see rising property values. A simple way to identify an upward trend is to track the year-over-year price appreciation in the area. If home values have risen 5-10% annually over the past few years, that’s a promising indicator. Conversely, flat or declining prices are a red flag unless you have insider knowledge of an upcoming catalyst for growth.
Lastly, buyer demographics determine the type of renovations that will yield the highest return. A neighborhood with young professionals may favor modern, low-maintenance finishes, while a family-oriented area might prioritize extra bedrooms, outdoor spaces, and proximity to good schools. Tailoring your rehab budget to match neighborhood expectations ensures you appeal to the right buyers without over-improving the property.
In short, the right neighborhood aligns buyer demand, market growth, and demographic preferences in your favor. By analyzing these factors upfront, you increase your chances of executing a profitable flip while minimizing risk.
Evaluating Neighborhood Potential: A Real Example Breakdown
To assess whether a neighborhood is ripe for flipping, you need to look at specific data points: median sale prices, days on market (DOM), and inventory levels. Together, these metrics help you gauge demand, potential profit margins, and the speed at which you can expect to sell a renovated property. Let’s walk through a real-world example to see how these numbers come together.
Suppose you’re considering a neighborhood where the median sale price is $300,000. This figure gives you a baseline for estimating the After Repair Value (ARV) of a typical property in the area. If you find a distressed property for $200,000 and rehab costs are projected at $50,000, the total investment would be $250,000. With an ARV of $300,000, this leaves a potential gross profit of $50,000 before other costs like holding and selling expenses are factored in. A strong median sale price relative to your purchase and rehab costs is your first green flag.
Next, consider days on market (DOM). In this example, the average DOM is 30 days. This tells you properties in the area are selling quickly, which is crucial for flippers. A short DOM reduces your holding costs and minimizes the risk of market conditions changing before you can sell. If the DOM were closer to 90 days, you’d need to weigh the potential for longer holding periods against your projected profit margins.
Finally, look at inventory levels. If the neighborhood currently has a 2-month inventory, it’s a seller’s market. Low inventory indicates high demand, which can lead to competitive offers and shorter sales timelines. On the other hand, a 6-month inventory would suggest a buyer’s market, where properties take longer to sell and you might need to price more aggressively to move your flip.
By combining these three data points—median sale price, DOM, and inventory levels—you can quickly assess whether a neighborhood supports profitable flipping. In this example, the numbers indicate a strong potential market: a healthy ARV relative to costs, fast-moving properties, and low competition. This systematic approach ensures you’re not guessing but making data-backed decisions.
Screening Property Leads: Fast Math to Identify Promising Deals
When you're looking at multiple property leads, speed is critical. You need a quick way to screen out bad deals while focusing on the promising ones. The 70% rule is one of the fastest methods to do this. It helps estimate your Maximum Allowable Offer (MAO) — the most you should pay for a property. The formula is simple: MAO = (ARV x 0.70) - rehab costs. Let’s walk through a real example to see how this works in practice.
Suppose you’re evaluating a property with an estimated ARV of $300,000. The rehab costs are projected at $50,000. Using the 70% rule, you calculate the MAO as follows: ($300,000 x 0.70) - $50,000 = $210,000 - $50,000 = $160,000. This means $160,000 is the most you should offer to ensure the deal has enough profit margin to cover expenses and risk. If the seller is asking $180,000, you can quickly pass on the deal and move to the next lead because it doesn’t meet your criteria.
This quick math allows you to screen multiple properties in minutes. For example, if you have a list of ten leads, you can plug in the ARV and rehab costs for each and immediately eliminate those where the asking price exceeds your MAO. This narrows your focus to only the deals worth deeper evaluation, saving hours of analysis on properties that will never pencil out.
Keep in mind, this initial screen isn’t perfect. ARVs and rehab costs are estimates, so your numbers might shift after a detailed analysis. However, it’s an efficient way to filter out non-starters. For investors juggling dozens of leads, this method is invaluable for staying focused on high-potential deals.
By mastering fast math like the 70% rule, you can avoid getting bogged down in spreadsheets and spend more time pursuing deals that actually make sense. Efficiency is key, especially in competitive markets where the best opportunities don’t last long.
Run these numbers on a real deal in seconds
FlipSmrt turns an address into ARV, a rehab budget, and your Maximum Allowable Offer automatically.
Analyze a Property FreeNuances and Red Flags: When a Good Market Can Still Hide Bad Deals
Even in an excellent flip market, not every deal will be a winner. Some properties can seem like a slam dunk on paper but carry hidden pitfalls that erode your profit margins. Recognizing these red flags early can save you from costly mistakes. Here are three common traps to watch out for, even in high-potential neighborhoods.
Oversaturated Markets: A strong neighborhood can quickly become overrun with investors chasing the same returns. This oversaturation leads to rising purchase prices and increased competition when it’s time to sell. For example, imagine a neighborhood where the After Repair Value (ARV) averages $300,000. If the area suddenly floods with flip properties, buyers may have too many options, forcing you to lower your listing price or accept longer holding times. Always check the volume of active flips and comparable sales within a quarter-mile radius before committing.
Hidden Repair Issues: A well-priced property in a great area can still derail your budget if it comes with unexpected repair costs. For instance, a house listed for $150,000 with a visible need for $50,000 in rehab might seem like a deal if the ARV is $250,000. However, hidden issues like foundation cracks, mold, or outdated electrical systems could easily add $20,000 or more to your renovation budget. Always schedule a thorough inspection and leave room in your budget for surprise expenses—typically an extra 10-15% of the estimated rehab cost.
Misleading Listings: Some properties are marketed with ARVs or rehab estimates that are overly optimistic. A listing might claim an ARV of $400,000 based on a single recent sale, ignoring that most comparable properties in the area top out at $350,000. Similarly, “light cosmetic updates” can turn into a full-scale renovation once you dig into the details. Verify every number yourself, analyzing multiple comps and walking through the property to confirm the scope of work.
Ultimately, even in a promising market, due diligence is non-negotiable. Scrutinize every deal as if the market conditions were less favorable. By recognizing these red flags early, you can avoid costly surprises and focus on properties that truly align with your profit goals.
Common Mistakes When Vetting Flip Markets and Deals
Even seasoned investors can make costly mistakes when analyzing flip markets and deals. One common error is over-relying on the buzz around so-called "hot markets." Just because a neighborhood is trending on social media or featured in a real estate article does not mean it will guarantee strong profits. These areas often come with inflated property prices or intense competition that can shrink your margins. For example, if you pay $400,000 for a property in a highly publicized market with an ARV of $500,000 but need $75,000 in renovations, the deal will fail the 70% rule. Buzz alone should never replace careful math.
Another frequent oversight is ignoring local regulations. Zoning laws, permitting timelines, and inspection requirements vary dramatically between municipalities and can impact your project timeline and costs. For instance, some cities may require additional permits for exterior work or have specific rules for historic properties that can drive up rehab expenses or delay your timeline. Failing to account for these factors could mean underestimating your carrying costs, eroding your projected profit margins.
Investors also often fail to adjust their numbers for market-specific costs. Labor and materials can vary widely depending on location. A roof replacement that costs $8,000 in a suburban Midwest market might cost $15,000 in a high-cost urban area. Similarly, closing costs, property taxes, and holding expenses can differ significantly by state or county. If you rely on generic rehab estimates or national averages, your numbers may look profitable on paper but collapse under real-world conditions.
Lastly, don't overlook local economic trends. A market with a declining population, high unemployment, or slow home sales can undermine even the best flip. If homes sit on the market for months, your holding costs will eat into your profits, or worse, your property might sell for less than the ARV you projected. Always research days on market, job growth, and demand indicators before committing.
The key takeaway: do your homework. Avoid chasing hype, dig into local rules, and tailor your numbers to the specific market. A disciplined approach helps you steer clear of costly mistakes and focus on deals that truly make sense.
FAQ: Quick Answers for First-Time Market Analysts
What data sources should I use? Start with a mix of free and paid tools. Zillow and Redfin are great for initial market research and comparable sales. For deeper insights, consider tools like PropStream or MLS access for historical sales data, foreclosure lists, and tax records. Use FlipSmrt to quickly calculate ARV and rehab costs once you have a property address. Public records, like county assessor websites, can verify property details and ownership history.
How many properties should I analyze? Aim to analyze at least 20-30 properties in a target neighborhood before locking in your first deal. This gives you a strong sense of the local ARV range, typical repair costs, and market trends. If a property doesn’t meet your criteria on a quick numbers check (like the 70% rule), move on. The goal is to refine your eye for what’s truly a deal versus a dud, and that takes consistent practice.
What’s a deal-breaker in a listing? Major structural issues (like foundation cracks or severe water damage) can be deal-breakers unless you’re very experienced and prepared for larger risks. Also, avoid properties in neighborhoods with declining values or high crime rates unless you have a strong reason to believe the area is turning around. Listings with inflated asking prices that don’t align with ARV and repair costs are also signs to walk away. Always do the math before proceeding.
How can I spot undervalued neighborhoods? Look for areas with rising demand but still affordable prices. Indicators include nearby redevelopment, improving schools, and expanding infrastructure. Track days-on-market trends and price appreciation over the past year. Undervalued neighborhoods often sit next to hot markets and show early signs of growth.
How do I know if I’m overpaying? Use the 70% rule as a baseline: Maximum Allowable Offer = (ARV x 0.70) - repair costs. If your offer exceeds this, you’re likely overpaying. You can adjust slightly for competitive markets, but stick to the math. Overpaying erodes your profit margins and can turn a flip into a financial loss.
Ready to analyze your next deal?
Get instant ARV, renovation estimates, and full deal math. Your first analysis is on us.
Start Free Analysis