
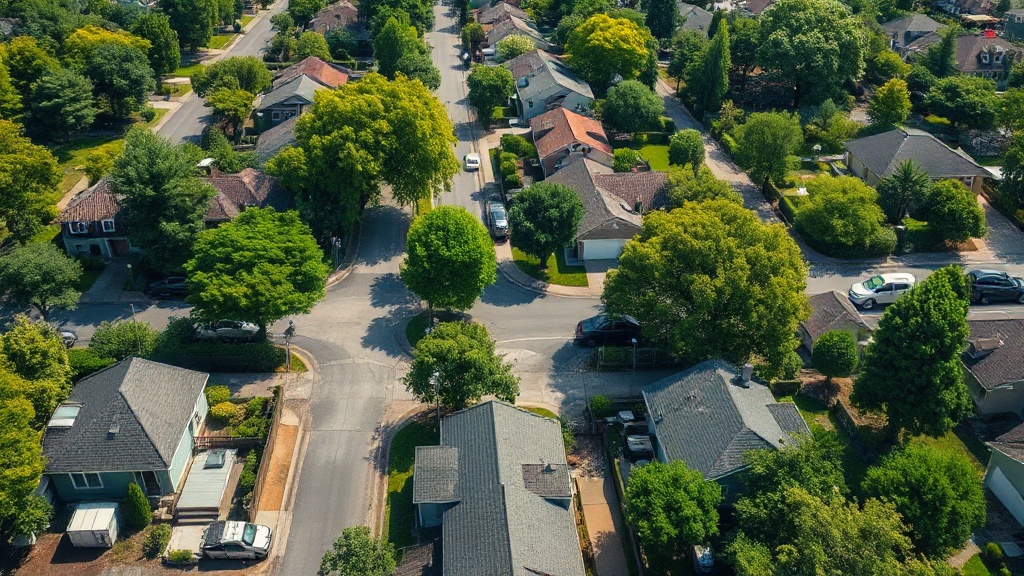
Why Neighborhood Selection Matters in Flipping
Neighborhood selection is one of the most critical factors in fix-and-flip success. Even with an accurate rehab budget and strong deal math, a poor location can sink your profit potential. The After Repair Value (ARV) of a property is directly tied to the values of comparable homes in the area. If the neighborhood has low demand or is declining, your ARV could end up far below expectations, leaving you with a property that takes months to sell or requires a price cut to move.
Want to skip the spreadsheet? FlipSmrt pulls comps, estimates ARV and rehab, and runs the deal math from just an address. Try your first analysis free.
Buyer demand is another key reason to focus on location. In high-demand neighborhoods, renovated homes sell faster and often above asking price. These are areas where owner-occupiers want to live, often due to proximity to good schools, job centers, or amenities like parks and shops. On the flip side, flipping in a location with stagnant or shrinking demand increases your holding costs and risks leaving you with a property no one wants. Even a beautifully renovated house won’t sell if buyers aren’t interested in the area.
Neighborhood choice also influences the scope and cost of renovations. For example, buyers in a luxury market will expect high-end finishes like quartz countertops and hardwood flooring, while entry-level markets may only require durable, cost-effective updates. Misjudging what’s appropriate for the area can lead to over-improving (wasting money on upgrades the market won’t pay for) or under-improving (failing to attract buyers). Both scenarios eat into your profit margin.
A location mistake can turn a solid deal on paper into a financial loss. Imagine purchasing a property with a projected ARV of $300,000 in a neighborhood you thought was growing, only to find out after closing that recent sales have been closer to $260,000. That $40,000 gap, combined with holding costs and closing fees, could erase your profit entirely. Choosing the wrong neighborhood doesn’t just impact one metric—ARV, buyer demand, and renovation choices are all intertwined, making this decision foundational to your success.
Key Metrics to Identify a Flipping-Friendly Market
When evaluating whether a neighborhood is ripe for fix-and-flip deals, certain metrics can reveal its potential for profitability. The three most important indicators are median home price trends, days on market (DOM), and the sale-to-list price ratio. Together, these metrics provide a snapshot of how properties are performing and whether demand supports quick, profitable sales.
Start with median home price trends. A neighborhood where prices are steadily increasing is often a good sign of demand and potential appreciation. For example, if a city’s median home price is $250,000 and has been growing at 5% annually, you can reasonably expect a median price of $262,500 next year. This kind of growth suggests buyers are actively competing for homes, which benefits flippers aiming to sell quickly at a higher price point.
Next, consider the days on market (DOM). This metric shows how long listings typically take to sell. In a flipping-friendly neighborhood, a low DOM indicates strong buyer demand. For instance, if the average DOM in your target area is under 30 days, it signals a hot market where homes are moving fast. Conversely, a higher DOM (90 days or more) might suggest oversupply or weak demand, making flips riskier and potentially tying up your capital longer than planned.
The sale-to-list price ratio is another key metric. This figure shows what percentage of the asking price homes are selling for. A ratio above 100% means properties are selling above list price, often due to bidding wars. For example, if the ratio in your target neighborhood is 103%, flippers can expect strong resale prices. On the other hand, a ratio below 95% might indicate sellers are struggling and buyers have the upper hand, which could limit your profit margins.
By focusing on these three metrics—price trends, DOM, and sale-to-list ratios—you can identify neighborhoods with the best potential for flipping success. Look for areas with steady price appreciation, low DOM, and sale-to-list ratios near or above 100%. These indicators point to strong demand and favorable conditions for a profitable flip.
How to Analyze a Specific Neighborhood: A Numeric Example
Let’s break down a practical example to evaluate whether a neighborhood is a good candidate for fix-and-flip investing. Imagine you’re looking at a neighborhood where the median home price is $220,000, and comparable sales suggest an average After Repair Value (ARV) of $300,000 for fully renovated properties. The average Days on Market (DOM) for sold homes in this area is 30 days. On the surface, this seems promising, but let’s dig deeper.
First, consider the spread between the median price and the ARV. A $300,000 ARV compared to a $220,000 median price gives an $80,000 gap. That spread is critical because it must cover your acquisition costs, rehab costs, holding costs, and still leave room for profit. If you estimate rehab costs at $50,000 and use the 70% rule to calculate your Maximum Allowable Offer (MAO), the math looks like this: $300,000 x 0.70 = $210,000 – $50,000 = $160,000. This means you should not pay more than $160,000 for a property here to stay within a safe margin.
Next, examine the average DOM. With homes selling in just 30 days, the market is moving quickly. This reduces your holding costs—expenses like loan interest, property taxes, and utilities that accrue while the property sits unsold. A faster sale also lowers the risk of market shifts during your holding period, which is crucial in a flipping strategy.
Finally, check for comparable sales that support the $300,000 ARV. If most renovated homes in this area are selling between $295,000 and $310,000, the projection is solid. However, if there are only a few comps and they vary widely, the ARV is less reliable. Always verify that the ARV aligns with recent, nearby sales of similar properties.
Based on this analysis, the neighborhood shows good potential due to the healthy ARV spread, low DOM, and verifiable comps. However, your success will hinge on acquiring properties below the MAO and keeping rehab costs under control. Always verify your numbers before committing to a deal.
Run these numbers on a real deal in seconds
FlipSmrt turns an address into ARV, a rehab budget, and your Maximum Allowable Offer automatically.
Analyze a Property FreeRed Flags to Avoid When Choosing a Neighborhood
Not all neighborhoods are created equal when it comes to fix-and-flip opportunities. Ignoring potential red flags can quickly turn a promising deal into a financial headache. One major risk is stagnant or declining home prices. If property values in the area have been flat or trending downward for years, it could indicate weak demand. For example, if the average home price in a neighborhood has hovered around $200,000 for the past five years with little growth, your After Repair Value (ARV) may struggle to justify the renovations and effort you’ll put in. Always check historical data on home price trends to ensure the area is appreciating or at least stable.
Another red flag is oversaturation from other investors. If a neighborhood is flooded with fix-and-flip activity, competition can drive up purchase prices while eroding profit margins. For instance, if you notice multiple homes on the same street being renovated and listed for sale, it might be a sign that the market is overheated. In such cases, buyers have more options, which could lead to longer holding times and lower resale prices. Running a quick search for active investor-owned properties in the neighborhood can help you gauge the level of activity and competition.
Zoning restrictions and local regulations are another critical factor to evaluate. Some neighborhoods have strict zoning codes or homeowner association (HOA) rules that can limit what renovations you’re allowed to undertake. For example, if you plan to add a second bathroom to increase the home’s value but the local zoning laws prohibit structural changes, your renovation plan could be derailed. Research zoning maps and reach out to the local planning department if you’re unsure about what’s allowed.
Finally, pay attention to neighborhood-specific issues like high crime rates or poor school ratings. These factors can scare off potential buyers, reducing demand for your flipped property. A property in a neighborhood with a crime rate 20% higher than the city average, for example, might sit on the market longer or sell for below your asking price. Use publicly available data to assess these risks before committing to a deal.
The takeaway: avoid neighborhoods with stagnant prices, excessive investor competition, restrictive zoning, or other buyer deterrents. Spotting these red flags early can save you from sinking time and money into a losing deal.
Common Mistakes When Vetting Deals by Location
One of the biggest mistakes investors make is relying solely on gut feelings when choosing a location. A neighborhood might feel "up-and-coming" based on a few trendy coffee shops or new construction projects, but without hard data, those impressions can be misleading. For example, if you purchase a property in an area based on a hunch, only to find that comparable sales (comps) don’t justify your projected After Repair Value (ARV), you could lose significant money. FlipSmrt removes the guesswork by instantly providing accurate comps and ARV estimates so you can make data-driven decisions.
Another common error is ignoring local economic indicators. Metrics like job growth, population trends, and school district rankings play a huge role in property demand and resale value. A neighborhood with declining employment opportunities or a shrinking population may leave you sitting on a property longer than expected. Investors who skip this type of research may end up with a deal that looked good on paper but struggles to sell. By using tools like FlipSmrt, you can focus on neighborhoods where the numbers support strong buyer demand and profitability.
Overestimating buyer demand is another frequent pitfall. Many investors assume that if one property sold quickly in an area, theirs will too. However, demand can vary by property type, price point, and even the time of year. For example, a $500,000 flip in a neighborhood where most buyers are seeking homes under $400,000 might sit on the market far longer than anticipated. FlipSmrt’s deal math helps you test these assumptions by calculating realistic profit margins and cash-on-cash returns based on local comps and rehab costs.
Finally, overlooking potential red flags in a neighborhood can derail even the best renovation project. High crime rates, poor school ratings, or lack of nearby amenities can deter buyers, no matter how well you renovate the property. FlipSmrt’s shareable investment reports allow you to document and analyze key location factors upfront, reducing the risk of costly oversights.
The takeaway: avoid gut-driven decisions, confirm buyer demand with real data, and always evaluate the broader neighborhood dynamics. Leveraging tools like FlipSmrt ensures you’re vetting deals with clarity and precision, not guesswork.
FAQ: Neighborhood Analysis for Fix & Flips
How far should I look from my home? A good rule of thumb is to start within a one-hour drive from where you live. Staying closer to home allows you to manage the project more effectively and build relationships with local contractors, agents, and vendors. However, if your local market is overpriced or lacks flipping opportunities, consider exploring nearby cities or towns with better affordability and demand. Just make sure you understand the new market’s dynamics before committing.
What’s a good price-to-rent ratio for flips? While price-to-rent ratio is more commonly used to evaluate rental properties, it can still provide insights for flippers. A ratio between 10 and 15 often indicates a balanced market where home prices are not overly inflated compared to rental demand. For example, if a property is priced at $200,000 and could rent for $1,400 per month, the price-to-rent ratio is approximately 14. Avoid areas with ratios above 20, as high home prices relative to rents may signal weaker overall demand.
How do I spot gentrifying areas? Gentrifying neighborhoods often have telltale signs like new coffee shops, boutique stores, and construction activity. Look for areas where housing prices are rising but still affordable compared to nearby trendy neighborhoods. For example, if the average price in a hot area is $400,000, but a bordering neighborhood averages $250,000, this may indicate an opportunity. Also, pay attention to planned infrastructure projects, such as new transit lines or public parks, which can attract future buyers to the area.
Can I rely on online data alone to pick a neighborhood? Online data is a great starting point, but it shouldn't replace in-person visits. Platforms like Zillow, Redfin, and FlipSmrt can help you analyze trends, ARVs, and other metrics, but walking the neighborhood gives you insights into condition, curb appeal, and livability that data can’t capture. Talk to local real estate agents and residents to get a feel for the area’s potential.
Should I focus on high-crime areas for cheaper deals? High-crime areas can offer low purchase prices, but they come with significant risks. Buyers may be hesitant to move into such neighborhoods, which can delay your sale and reduce your profit. If you’re considering a high-crime area, look for signs of improvement, like declining crime rates or nearby developments. Always balance potential profit with the challenges of attracting buyers.
Ready to analyze your next deal?
Get instant ARV, renovation estimates, and full deal math. Your first analysis is on us.
Start Free Analysis