
What Makes a Neighborhood Ideal for Fix & Flips?
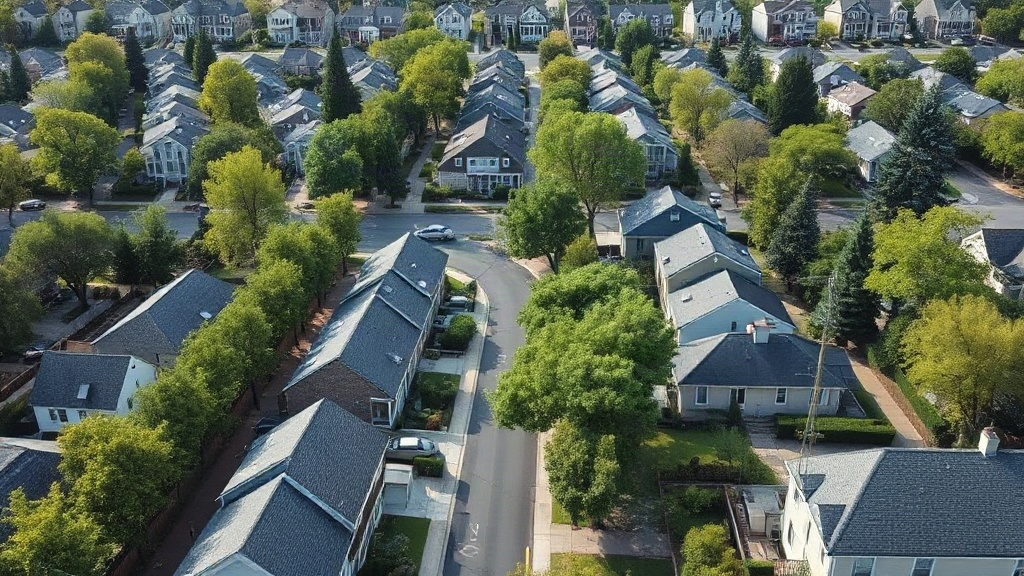
Not all neighborhoods are created equal when it comes to fix-and-flip opportunities. A profitable neighborhood is one where demand for renovated homes is strong, price appreciation trends are favorable, and the potential return on renovation costs is high. These factors ensure that your investment has a solid exit strategy and the potential for healthy margins. Let’s break down the essential characteristics to look for.
Want to skip the spreadsheet? FlipSmrt pulls comps, estimates ARV and rehab, and runs the deal math from just an address. Try your first analysis free.
1. Strong buyer demand: The best neighborhoods for flips have a steady stream of buyers actively purchasing homes. You can gauge demand by looking at metrics like days on market (DOM) and the ratio of active listings to recent sales. For example, if homes in an area are selling within 30 days of being listed, it signals strong demand. Concentrate on neighborhoods where renovated homes in your target price range are consistently selling quickly.
2. Price appreciation trends: A neighborhood with rising home values offers a safety net for your flip. Even if your project takes longer than expected, increasing prices can help protect your margins. Look for areas with consistent year-over-year appreciation. For instance, if property values in a neighborhood have risen by 5-8% annually over the past three years, it suggests a positive trend. Avoid areas with volatile or stagnant prices, as they add risk to your investment.
3. High renovation ROI: Not every dollar spent on renovations will translate into profit. Focus on areas where buyers are willing to pay a premium for updated homes. For example, if comparable renovated homes are selling for $100,000 more than their as-is counterparts, and your estimated rehab costs are $50,000, the ROI on renovations is favorable. Research local buyer preferences—such as open-concept layouts, modern kitchens, or energy-efficient upgrades—to ensure your rehab budget targets features that drive higher resale value.
By zeroing in on neighborhoods with these characteristics, you can increase your chances of executing a profitable flip. Strong demand, steady appreciation, and high renovation ROI are the cornerstones of a successful deal, and these metrics should guide your neighborhood selection process.
Using Local Market Data to Spot Opportunities
Local market data can reveal undervalued neighborhoods with strong potential for profitable fix & flips. Key metrics to examine include median sale prices, days on market (DOM), and price per square foot (PPSF). These indicators help you identify areas where properties are selling quickly, have room for price appreciation, or are priced below market trends. The goal is to find neighborhoods where your investment can yield a solid return without sitting stagnant.
Consider two zip codes: 12345 and 67890. In zip code 12345, the median sale price is $300,000, the average DOM is 15 days, and the PPSF is $150. In zip code 67890, the median sale price is $250,000, the average DOM is 45 days, and the PPSF is $120. At first glance, zip code 67890 might seem like the better option because of the lower median sale price. However, the longer DOM suggests slower demand, and the lower PPSF may indicate a depressed market rather than an undervalued one. In contrast, zip code 12345's relatively higher prices are offset by faster turnover and a higher PPSF, signaling stronger buyer interest and potential for a quicker flip.
When using these metrics, look for neighborhoods where PPSF is lower than the surrounding areas but DOM is short. This combination suggests undervalued properties in areas with high buyer demand. For example, if neighboring zip codes average $200 PPSF while your target area is at $150, but DOM remains under 20 days, you may have found an opportunity for growth. Cross-reference this with recent sales to confirm trends and avoid basing decisions on outdated data.
Tools like FlipSmrt streamline this process by providing zip code-level data alongside property-specific insights. Instead of manually comparing numbers across multiple sources, you can instantly analyze the metrics that matter most. By focusing on areas with favorable market indicators, you increase your chances of finding properties that will sell quickly after rehab, maximizing your return on investment.
Evaluating a Specific Deal in Context: A Worked Example
Let’s say you’re considering a property with a purchase price of $200,000. After reviewing local comps, you determine the After Repair Value (ARV) is $320,000. The property needs $60,000 in repairs to reach that ARV. Using the 70% rule, you calculate the Maximum Allowable Offer (MAO) as follows:
MAO = (ARV x 0.70) - Repair Costs
Plugging in the numbers: MAO = ($320,000 x 0.70) - $60,000. That works out to MAO = $224,000 - $60,000, or $164,000. This means you shouldn’t pay more than $164,000 for the property to leave room for profit. Since the seller is asking $200,000, this deal doesn’t pencil out—at least not yet.
But raw numbers don’t tell the whole story. Neighborhood data can shift the equation. For example, if this property is in an area with rapidly increasing home values, you might revisit the ARV. Are nearby homes selling for $330,000 or $340,000 instead of $320,000? If so, your MAO rises accordingly. Conversely, if most flips in the area sit on the market for months, you’ll need to factor in higher holding costs or adjust your profit expectations downward.
Also, consider neighborhood-specific risks. Is the property on a busy street while the comps are on quiet cul-de-sacs? Are there zoning changes or development plans that could increase—or decrease—demand in the area? This is where tools like FlipSmrt can save time by pulling in hyper-local data alongside deal math, giving you a clearer picture of what’s realistic for this property.
The takeaway: Always verify your numbers in the context of the neighborhood. A seemingly bad deal might work if the local market is rising, but a good deal on paper can fail if you ignore neighborhood-specific factors.
Run these numbers on a real deal in seconds
FlipSmrt turns an address into ARV, a rehab budget, and your Maximum Allowable Offer automatically.
Analyze a Property FreeNuances and Red Flags: What the Numbers Won’t Tell You
While metrics like ARV and cash-on-cash return are vital, they don’t capture every factor that impacts a fix-and-flip project. Neighborhood-level nuances can make or break a deal, even if the numbers look great on paper. Ignoring qualitative factors—like school ratings, crime trends, or zoning restrictions—can lead to costly surprises.
Start with schools. In many markets, properties zoned for highly rated schools sell faster and for higher prices. For example, a home in a district with a top-rated elementary school might command a $20,000 premium over an identical home in a weaker district. Check public school ratings on sites like GreatSchools or Niche, but also consider trends. A school district with declining performance could signal future resale challenges.
Crime rates are another critical factor. Buyers often avoid areas with high or rising crime, which can limit your buyer pool and drag down ARVs. Research crime statistics from local police websites or tools like NeighborhoodScout. Pay attention to trends, not just raw numbers—an area with improving safety might attract new demand, while a sudden uptick in incidents could deter buyers.
Zoning and local ordinances can also derail your plans. Some neighborhoods have strict zoning rules or historical preservation requirements that limit what you can modify, delaying renovations or driving up costs. Verify zoning and permitting requirements with the local planning office before purchasing. For example, if you plan to add a bedroom or expand a kitchen, check if the property is in a restrictive overlay zone that might block those changes.
Finally, look into local development projects. A planned park or new shopping center can boost neighborhood desirability, while a nearby landfill or industrial expansion can have the opposite effect. Search city council minutes or local news for updates on infrastructure or commercial projects near your target property. For instance, a new transit station within walking distance could significantly elevate future resale value.
Qualitative factors like these don’t show up in your spreadsheets, but they can profoundly impact your flip’s success. Combine these insights with your deal math to avoid surprises and maximize returns.
Common Mistakes When Sourcing Deals in New Areas
Investing in unfamiliar neighborhoods can be profitable, but it comes with pitfalls that can derail even experienced investors. One common mistake is chasing "hot" markets without conducting proper due diligence. Just because a neighborhood is trending in the news or popular with other investors doesn't mean every deal there is a good one. For example, a buyer might hear about a booming area with rising prices and assume any property will yield a strong return. However, without verifying key metrics like ARV, days on market, or buyer demand, you could overpay for a property that sits unsold or underperforms.
Another frequent error is overestimating After Repair Values (ARVs) in new neighborhoods. ARV is critical for calculating your Maximum Allowable Offer (MAO), and guessing wrong can wipe out your profit. When you're new to an area, it's tempting to rely on optimistic numbers or averages rather than digging into truly comparable sales. For instance, a 1,500-square-foot home might sell for $350,000 in one part of the neighborhood but only $275,000 a few streets away. Without precise comps, you risk basing your deal math on inflated projections.
Relying solely on online data is another trap many investors fall into. While platforms like Zillow or Realtor.com can provide valuable insights, they rarely tell the full story. A property might look promising in photos, but a site visit could reveal critical issues like an industrial plant nearby, noisy traffic, or a poorly maintained street—all factors that can drive down buyer interest. Walking the area also helps you assess the local demographic, nearby amenities, and overall curb appeal, which are hard to judge through a screen.
To avoid these mistakes, take a systematic approach when evaluating neighborhoods. Verify ARVs using accurate, up-to-date comps. Spend time in the area to understand its true character. And don't rely on market hype—dig into the data yourself. A disciplined process reduces risk and helps you avoid overpaying or misjudging a property's potential.
FAQ: Quick Answers to Common Neighborhood Vetting Questions
How far should comps be from the property I’m analyzing? Ideally, comparable sales (comps) should be within a one-mile radius of the subject property. However, in dense urban areas, you may narrow this range to half a mile or less. The key is to match the neighborhood characteristics—crossing a major road or entering a different school district, for example, can make a comp less reliable. Use properties sold within the last 3-6 months to account for market shifts.
What’s the minimum profit margin I should aim for in a fix and flip? Most fix-and-flip investors aim for a profit margin of at least 10-15% of the After Repair Value (ARV). This ensures the deal remains worthwhile even if unexpected costs arise. For example, if the ARV of a property is $300,000, your target profit should be $30,000-$45,000. Keep in mind that your margin needs to account for holding costs, transaction fees, and taxes, so always build in a buffer.
How can I identify up-and-coming neighborhoods before they peak? Look for early indicators of growth such as rising property values, new business openings, or infrastructure projects like public transit expansions. Other signs include an influx of younger residents, increased building permits, or city development plans targeting the area. You can also monitor local real estate trends by attending city council meetings or networking with local agents and wholesalers who have on-the-ground insights.
How many comps should I analyze before making an offer? A minimum of three solid comps is recommended for accurate analysis, but five to six is ideal if available. The comps should closely match the subject property in size, condition, and features. More data points give you a clearer picture of the market, reducing the risk of over- or underestimating your property’s ARV.
What if I can’t find enough recent comps in the area? If recent comps are scarce, you can adjust by extending the timeframe to 12 months or expanding your search radius slightly. Just be cautious of market changes during that period. Alternatively, focus on the most similar properties available, even if they stretch the typical distance or date range. Tools like FlipSmrt can help you identify valid comps faster, even in tougher markets.
Ready to analyze your next deal?
Get instant ARV, renovation estimates, and full deal math. Your first analysis is on us.
Start Free Analysis